3D Data Visualization Deborah Schmidt
Head of Helmholtz Imaging Support Unit, MDC Berlin
Sep 17, 2025
In this seminar, we highlight various approaches and methodologies for visualizing scientific 3D datasets. Introduction
Hi, I’m Deborah, head of the Helmholtz Imaging Support Unit at MDC.
Helmholtz Imaging is here for you with Support Units at 3 centers, working in close collaboration with the Helmholtz Imaging Research Units. Members of all Helmholtz Imaging Support Units.
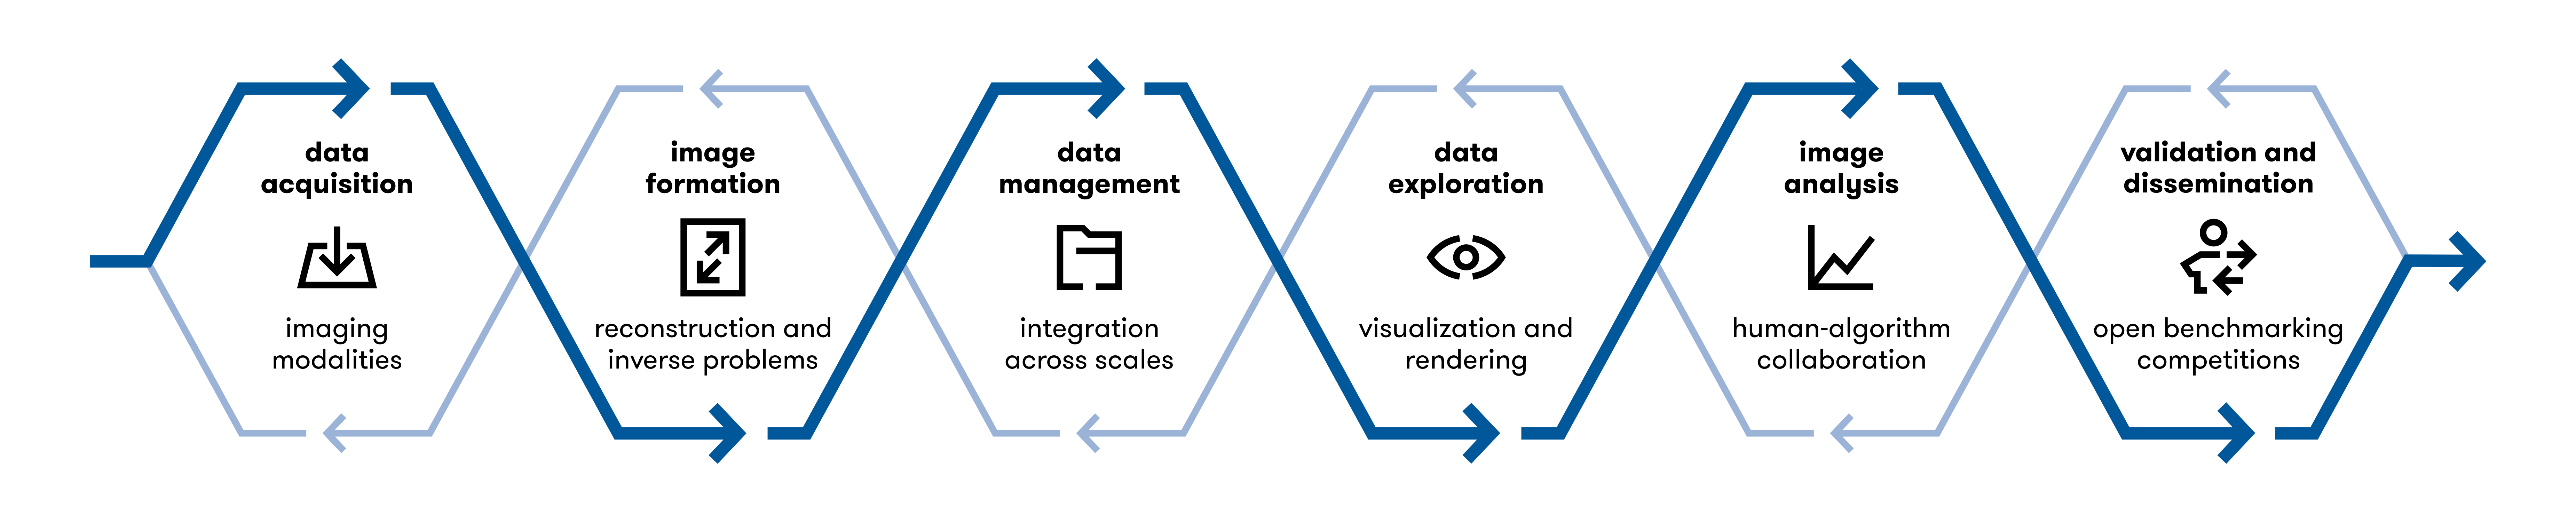
Introduction Consulting along the entire pipeline and across all research domains You can contact us with any question along the imaging pipeline. We are funded to support all Helmholtz centers in
Germany.
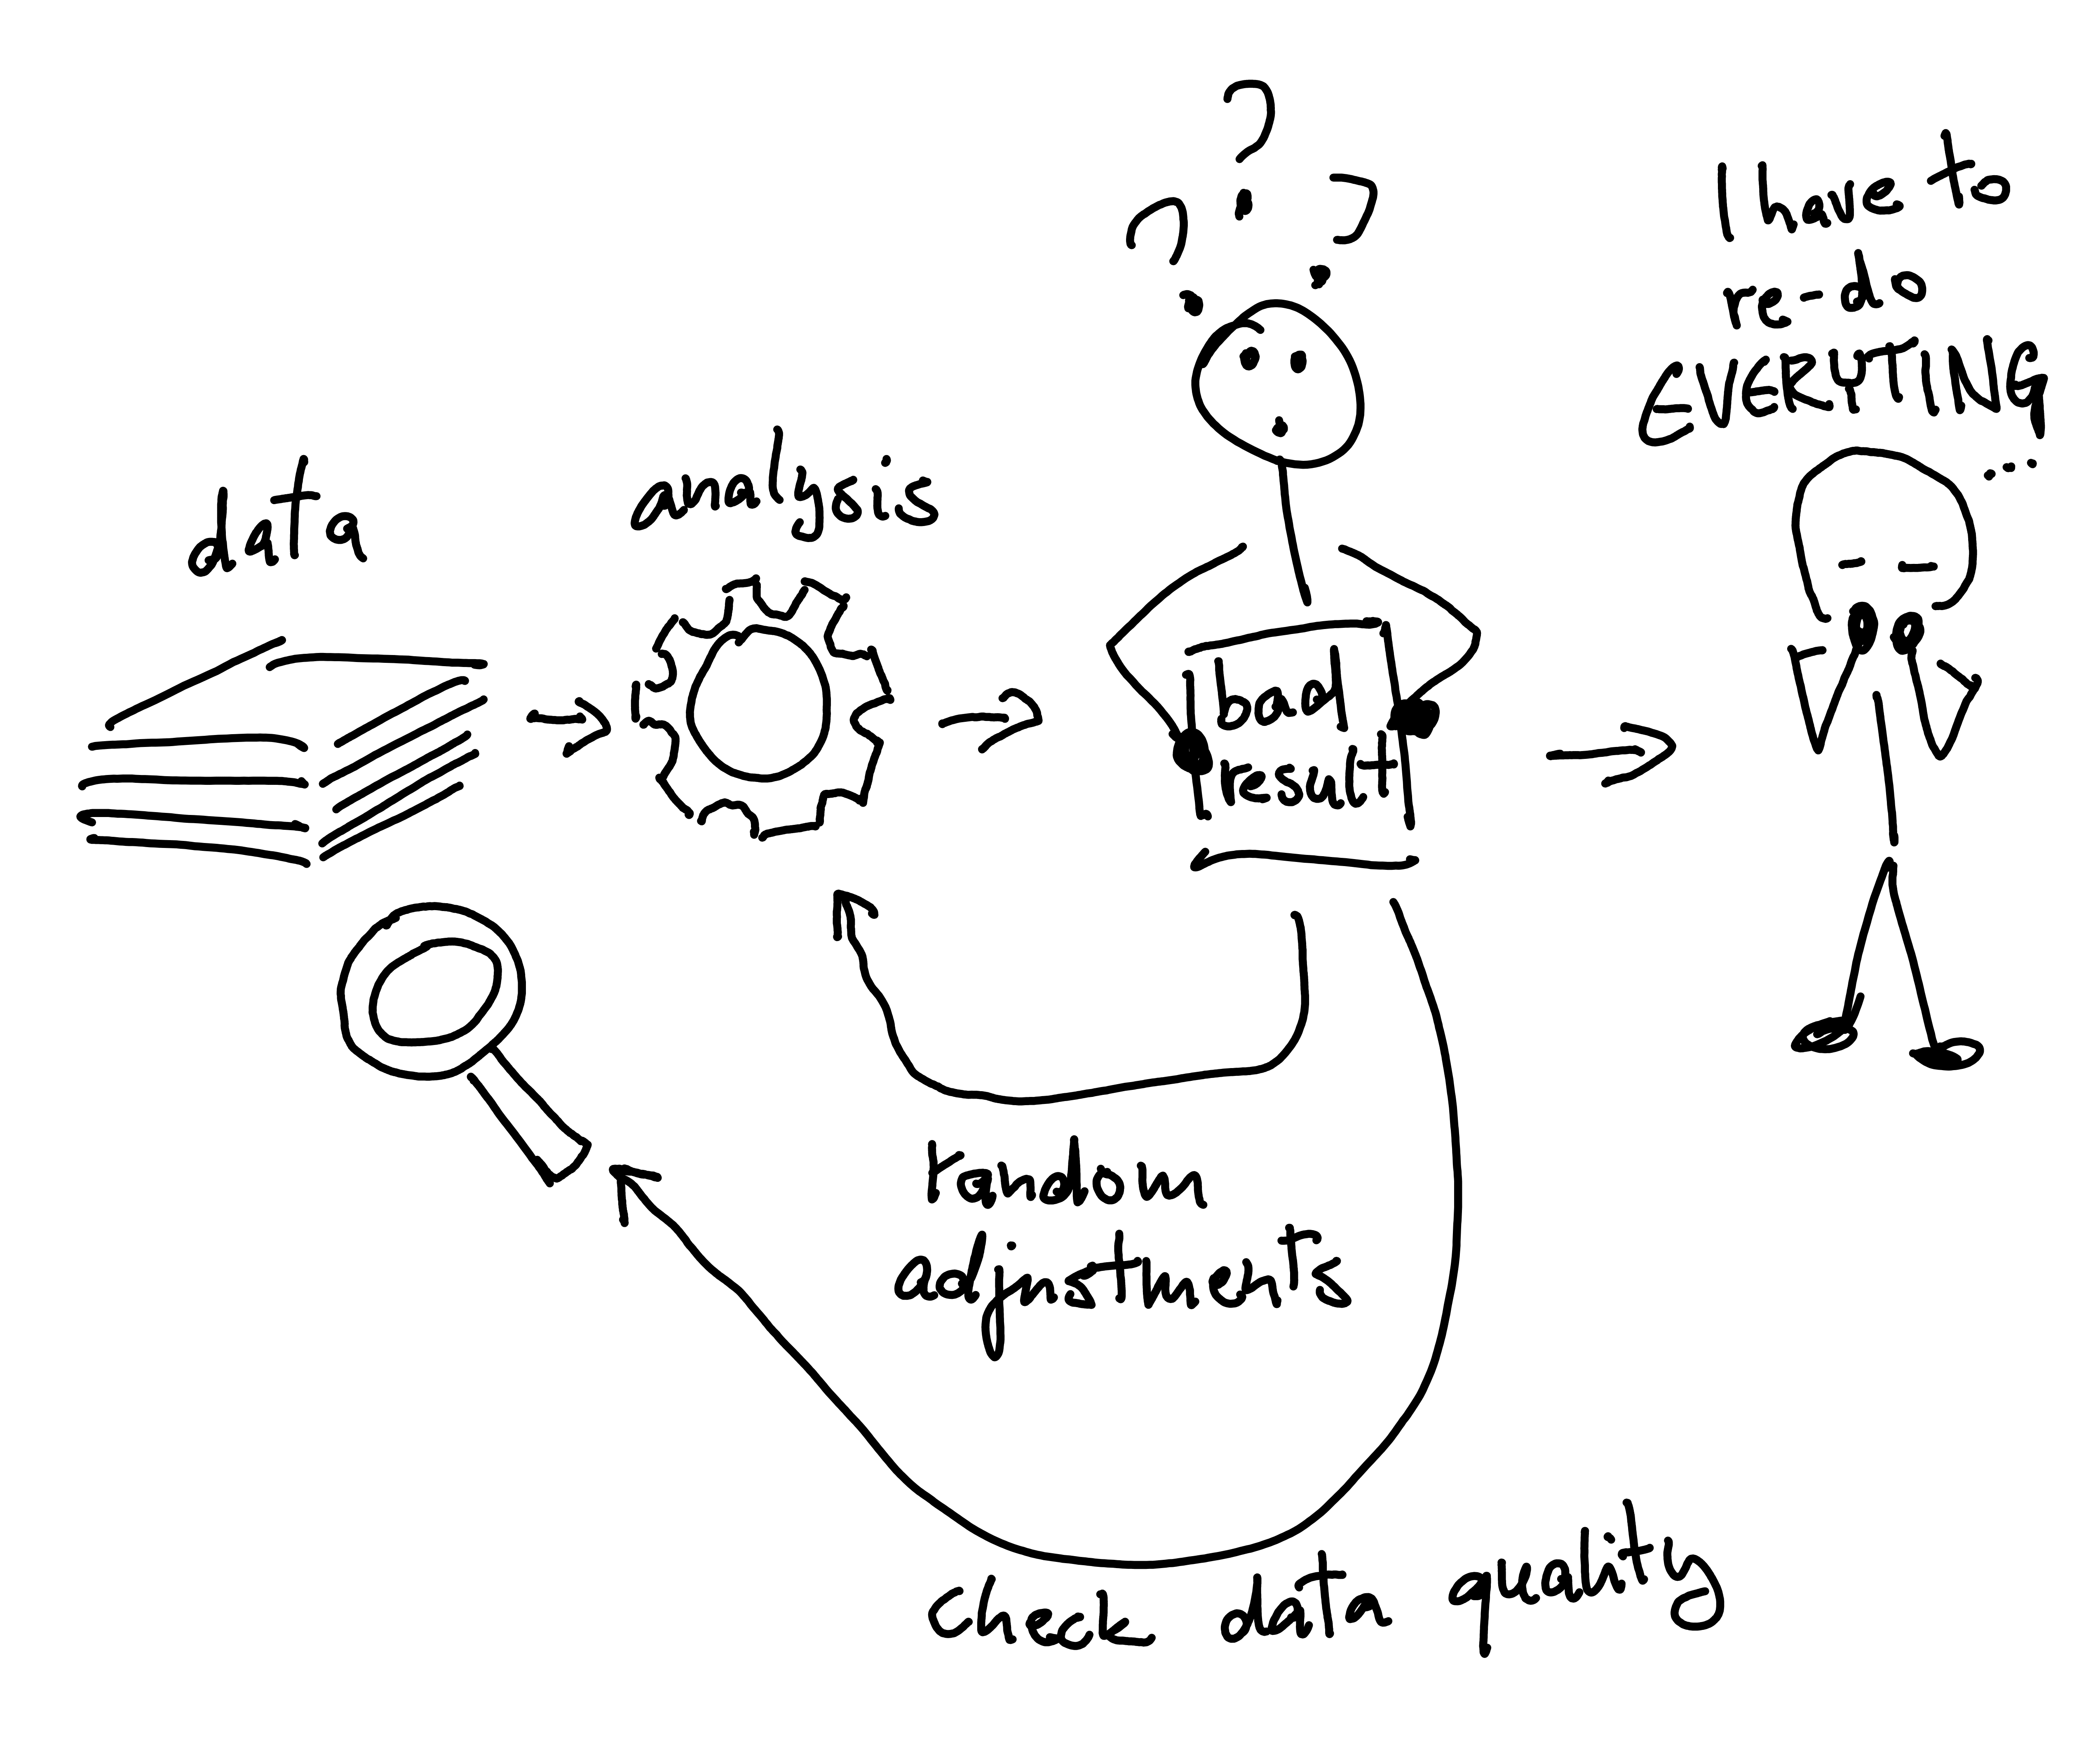
Coming up: Image Quality Assessment
Coming up: 3D Visualization Workshop
Preliminary program
Day 1: 3D Data Types, Image Assessment, and Volumetric Rendering
Day 2: Web-Based Viewers, Mesh Processing and Blender Rendering
Day 3: Storytelling with Visualization / Project Work
Day 4: Project Work and Presentations
3D Dataset types
Understanding the type of data you are working with is crucial for effective 3D rendering. Below, we outline the
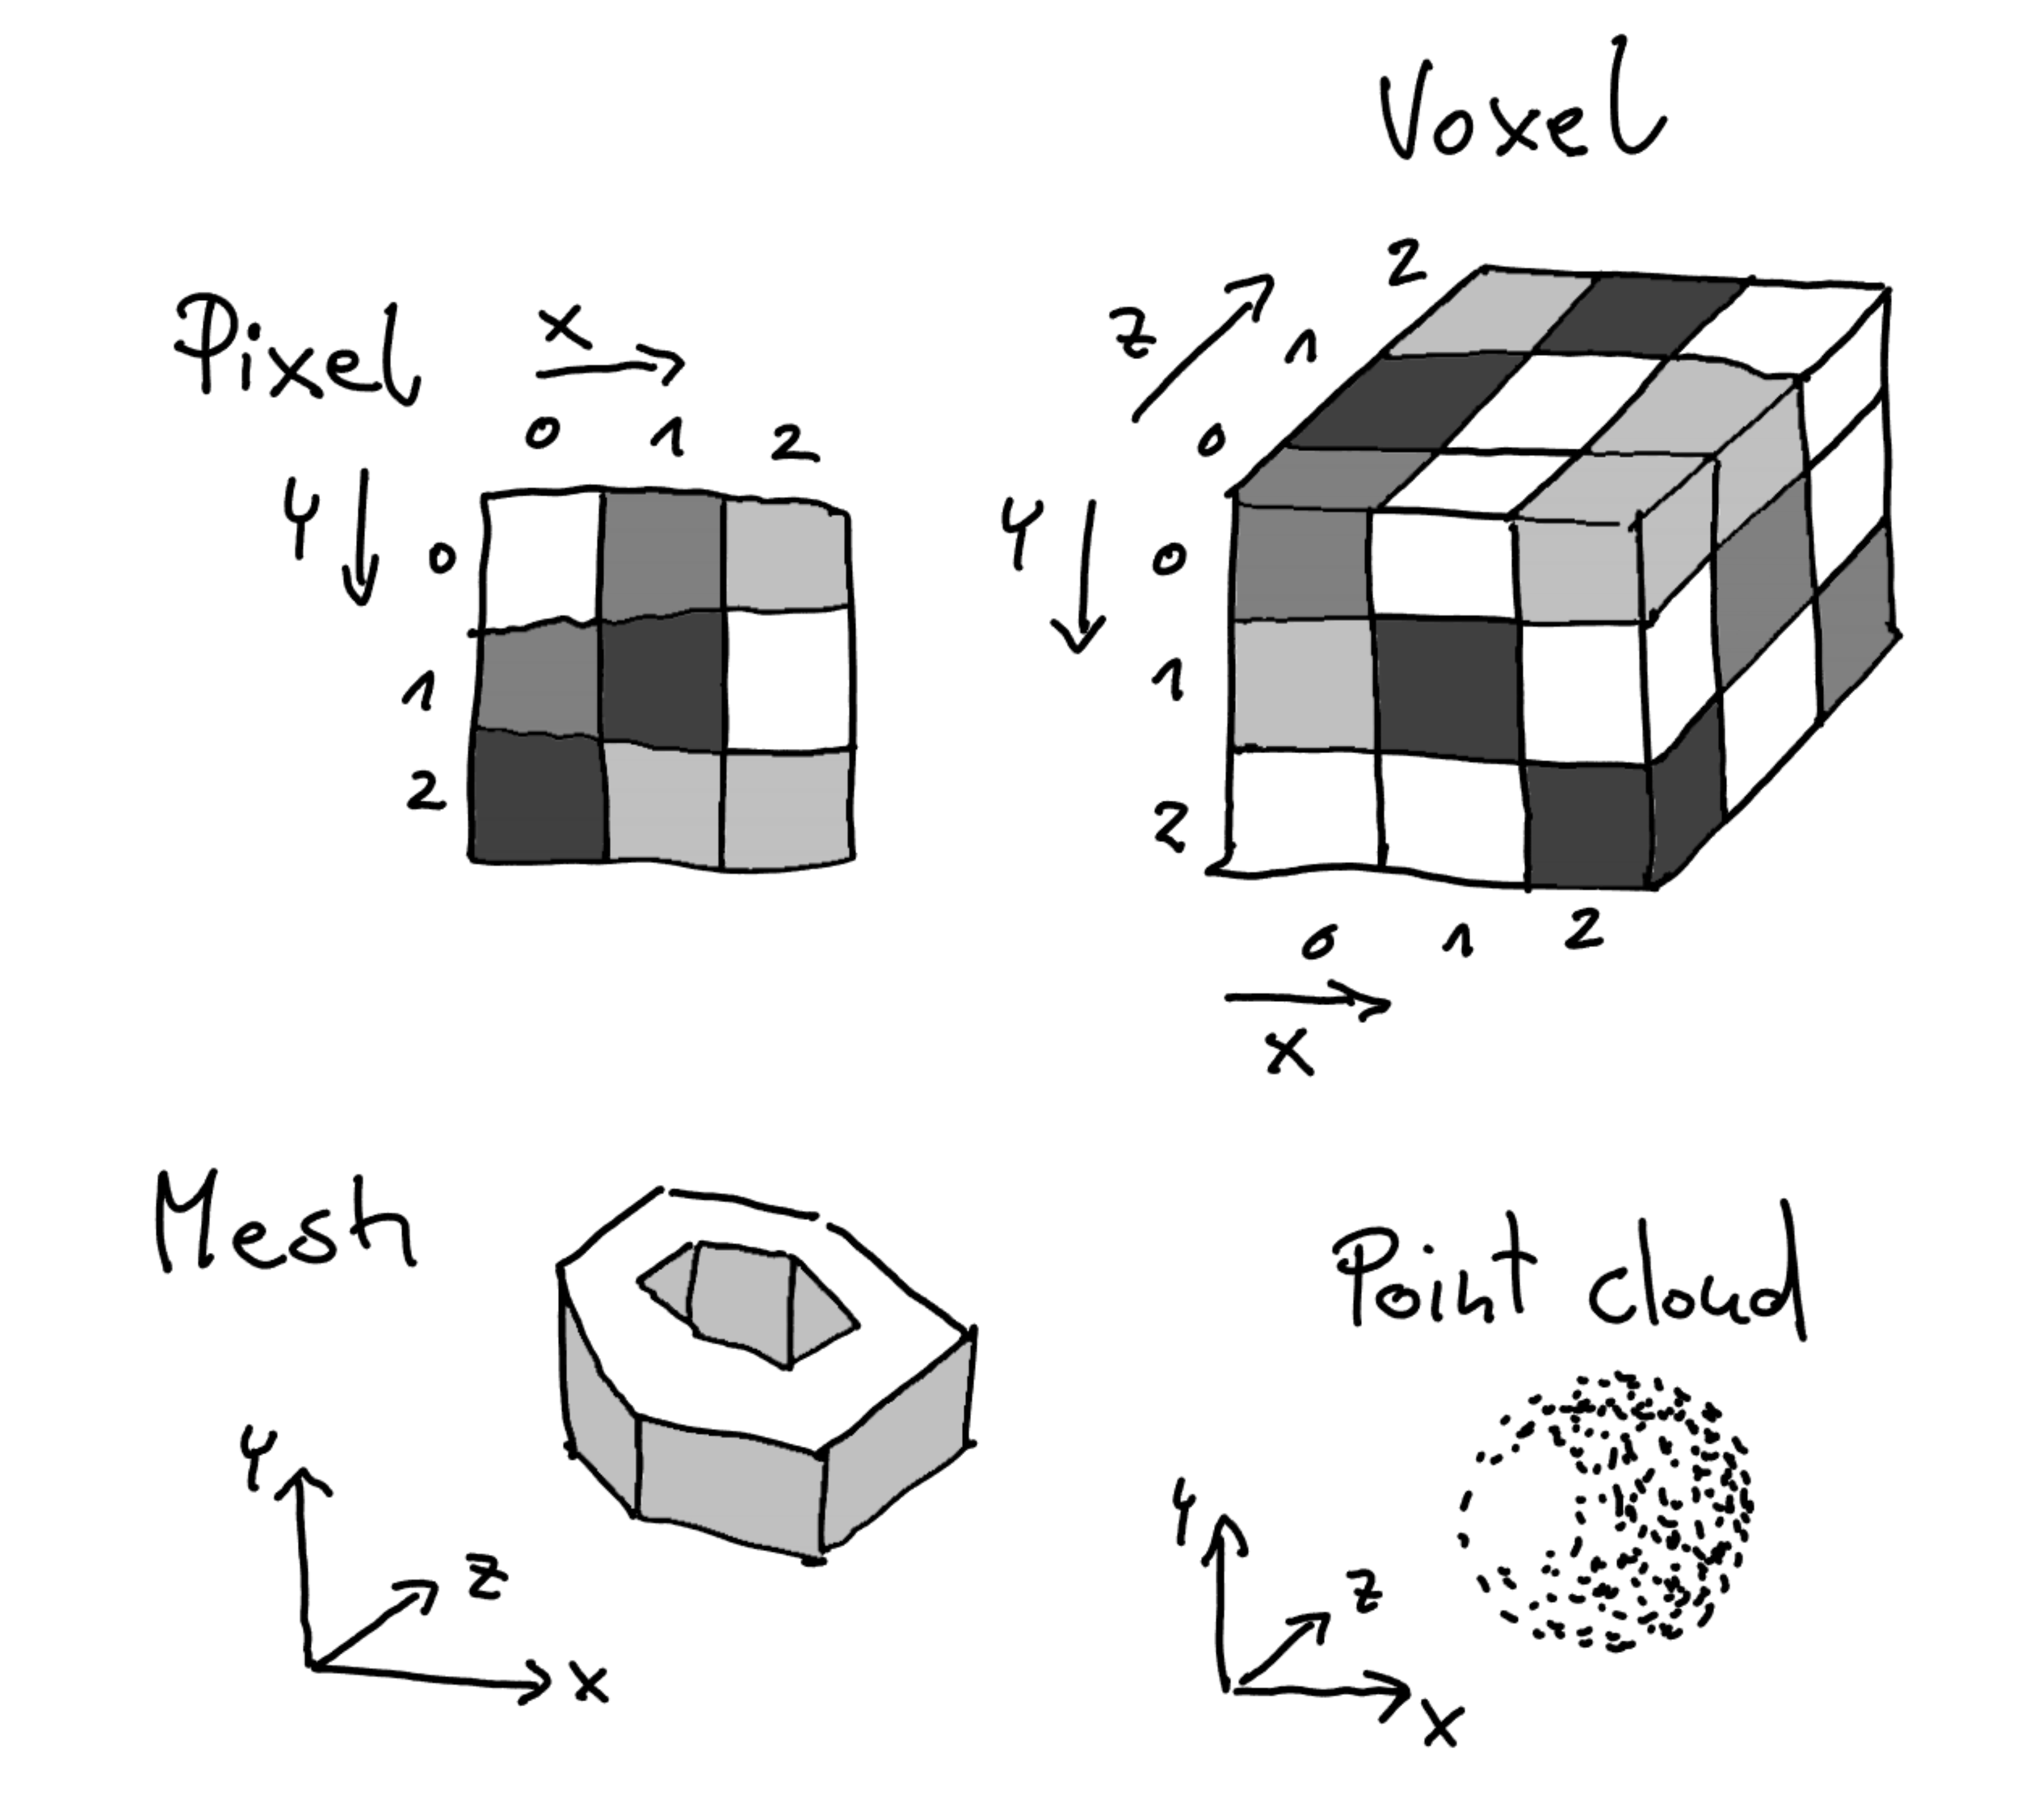
common categories of datasets that are often visualized in three dimensions. Voxel-Based Datasets (Euclidean-structured)Voxel-based datasets represent data as a grid of values (voxels) in Euclidean space , where each voxel holds a specific value, such as intensity in medical imaging (e.g., CT, MRI scans) or simulation results. These datasets are inherently structured and can be visualized using volume rendering, isosurface extraction, or slice-based views. Meshes (Non-Euclidean-structured)Meshes are composed of vertices, edges, and faces that define the surface of a 3D object. Unlike voxels, which describe volumes, meshes describe surfaces and are commonly used in computer graphics and CAD models . Meshes can be visualized through techniques like surface rendering, wireframe views, and texture mapping. Properties like curvature or scalar fields can also be mapped onto the mesh for enhanced interpretation. Point Clouds (Non-Euclidean-structured)Point clouds are a collection of points in 3D space, where each point is defined by its X, Y, Z coordinates . They are often derived from LiDAR scans, 3D scanning, or particle simulations. Visualization of point clouds often involves point-based rendering , surface reconstruction, or filtering techniques to highlight areas of interest.
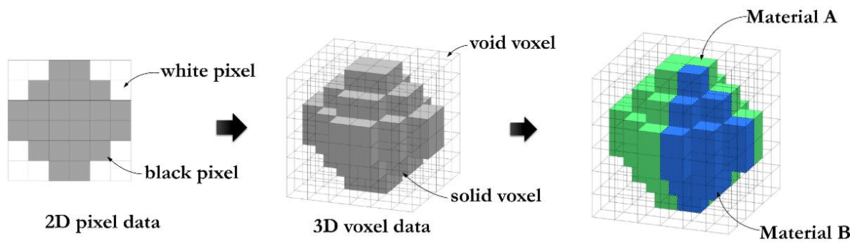
3D Dataset types Voxel-Based Images Represent the entire volume of an object in a structured grid. Each voxel holds a scalar value , often representing intensity in medical scans or simulation data. Best for representing interior details of a structure, e.g., in CT/MRI scans or simulations. Volumetric rendering and slice-based views are common visualization techniques.Voxel based data representation. Credit: Hasanov, S. et al. (2021), CC BY-SA 4.0 .
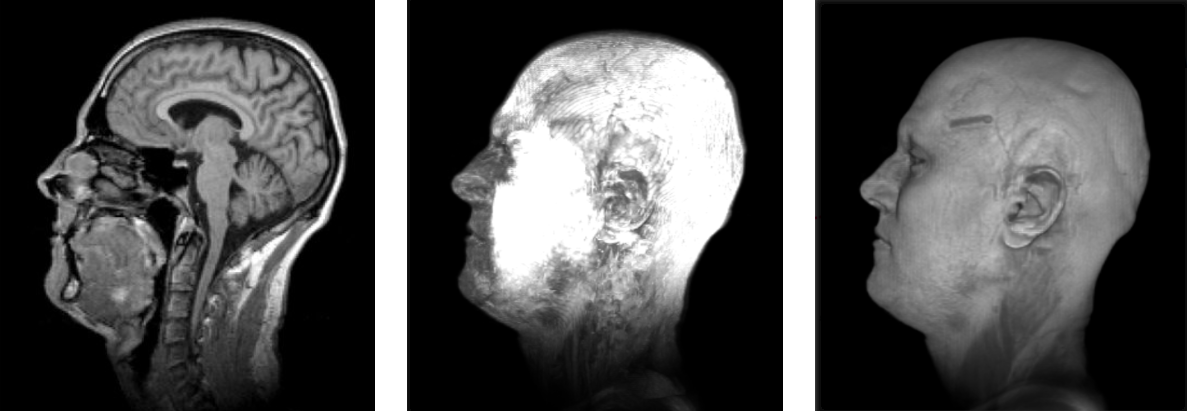
Visualizing volumetric datasets Volumetric datasets, such as medical imaging (CT/MRI scans) or fluid simulations, are complex datasets where each voxel represents a value in 3D space. In this section, we’ll explore the various techniques available for rendering and interacting with volumetric data. Slice-Based Visualization : This involves rendering 2D cross-sections or “slices” of the 3D dataset, often used in
medical imaging.Volume raycasting (max intensity, emission absorbtion)
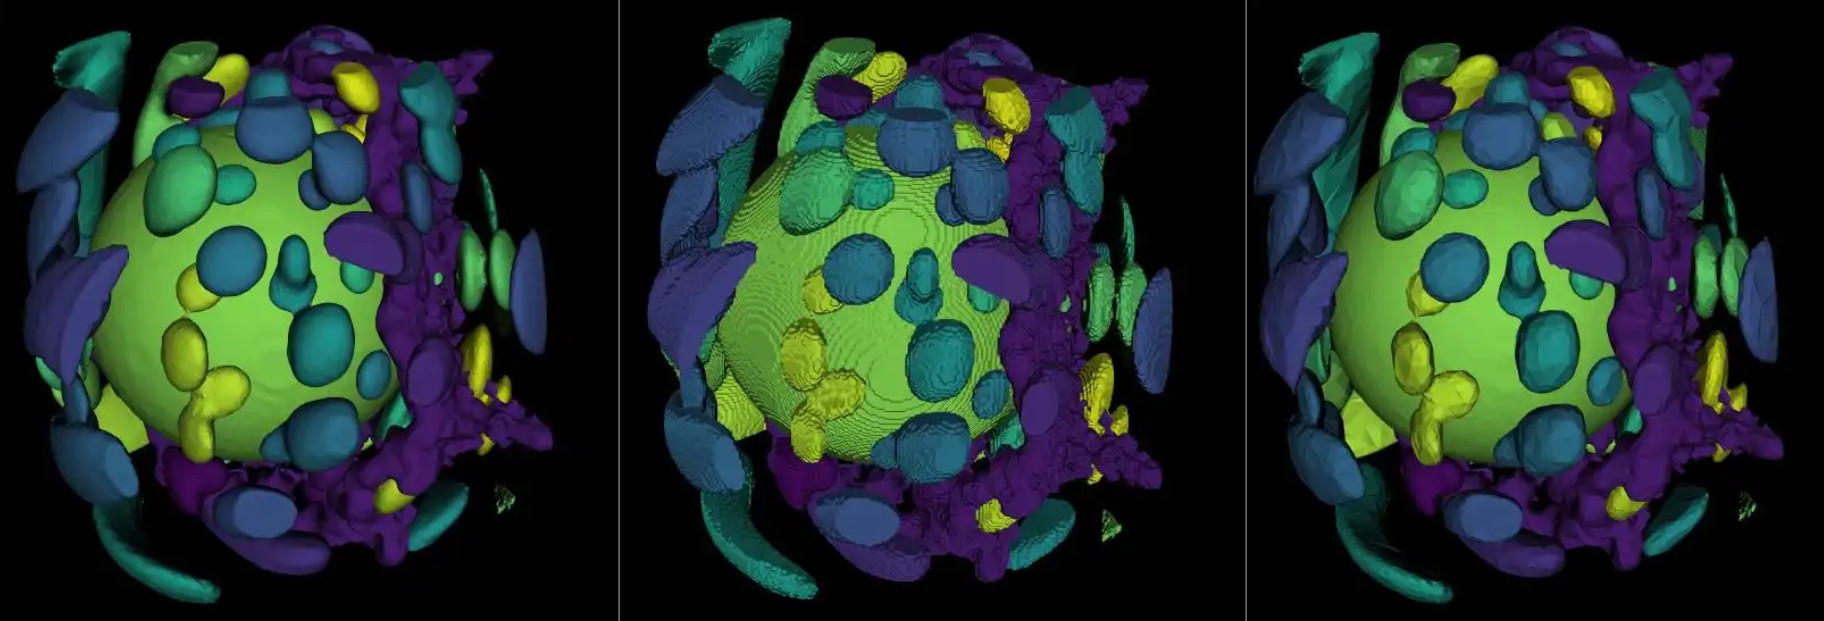
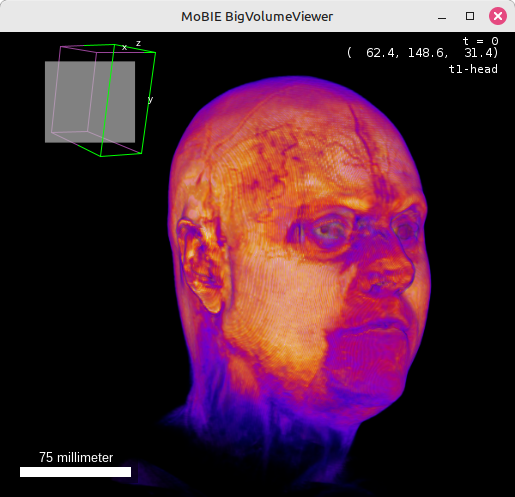
Visualizing volumetric datasets Transfer functions When working with unannotated volumetric datasets, you can explore the data interactively using transfer functions . Transfer functions map intensity values in the dataset to colors and opacities, allowing you to visualize different regions of the volume without defining hard boundaries. This technique is often used for soft, exploratory visualizations of the internal structures of the data.
Transfer Functions :
A transfer function defines how data values are mapped to colors and transparency. Example: Low intensity values may be mapped to transparent regions, while higher intensities are mapped to visible colors. Transfer functions are typically adjusted in visualization software like ParaView . By adjusting transfer functions, you can emphasize specific parts of the volume without needing concrete borders or segmentations.
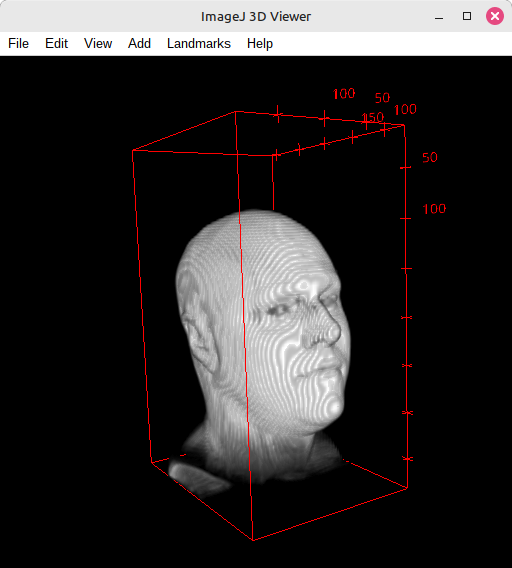
Visualizing volumetric datasets Demonstration
3DViewer
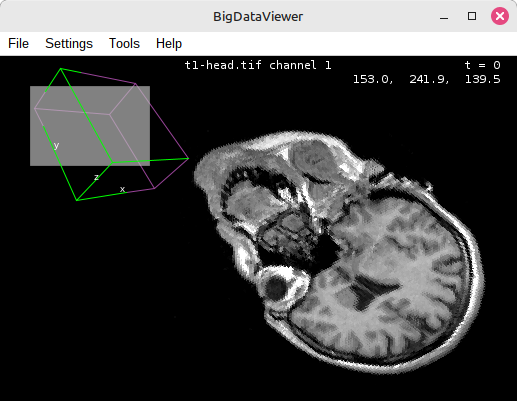
BigDataViewer
Mobie (BigVolumeViever)
Visualizing volumetric datasets
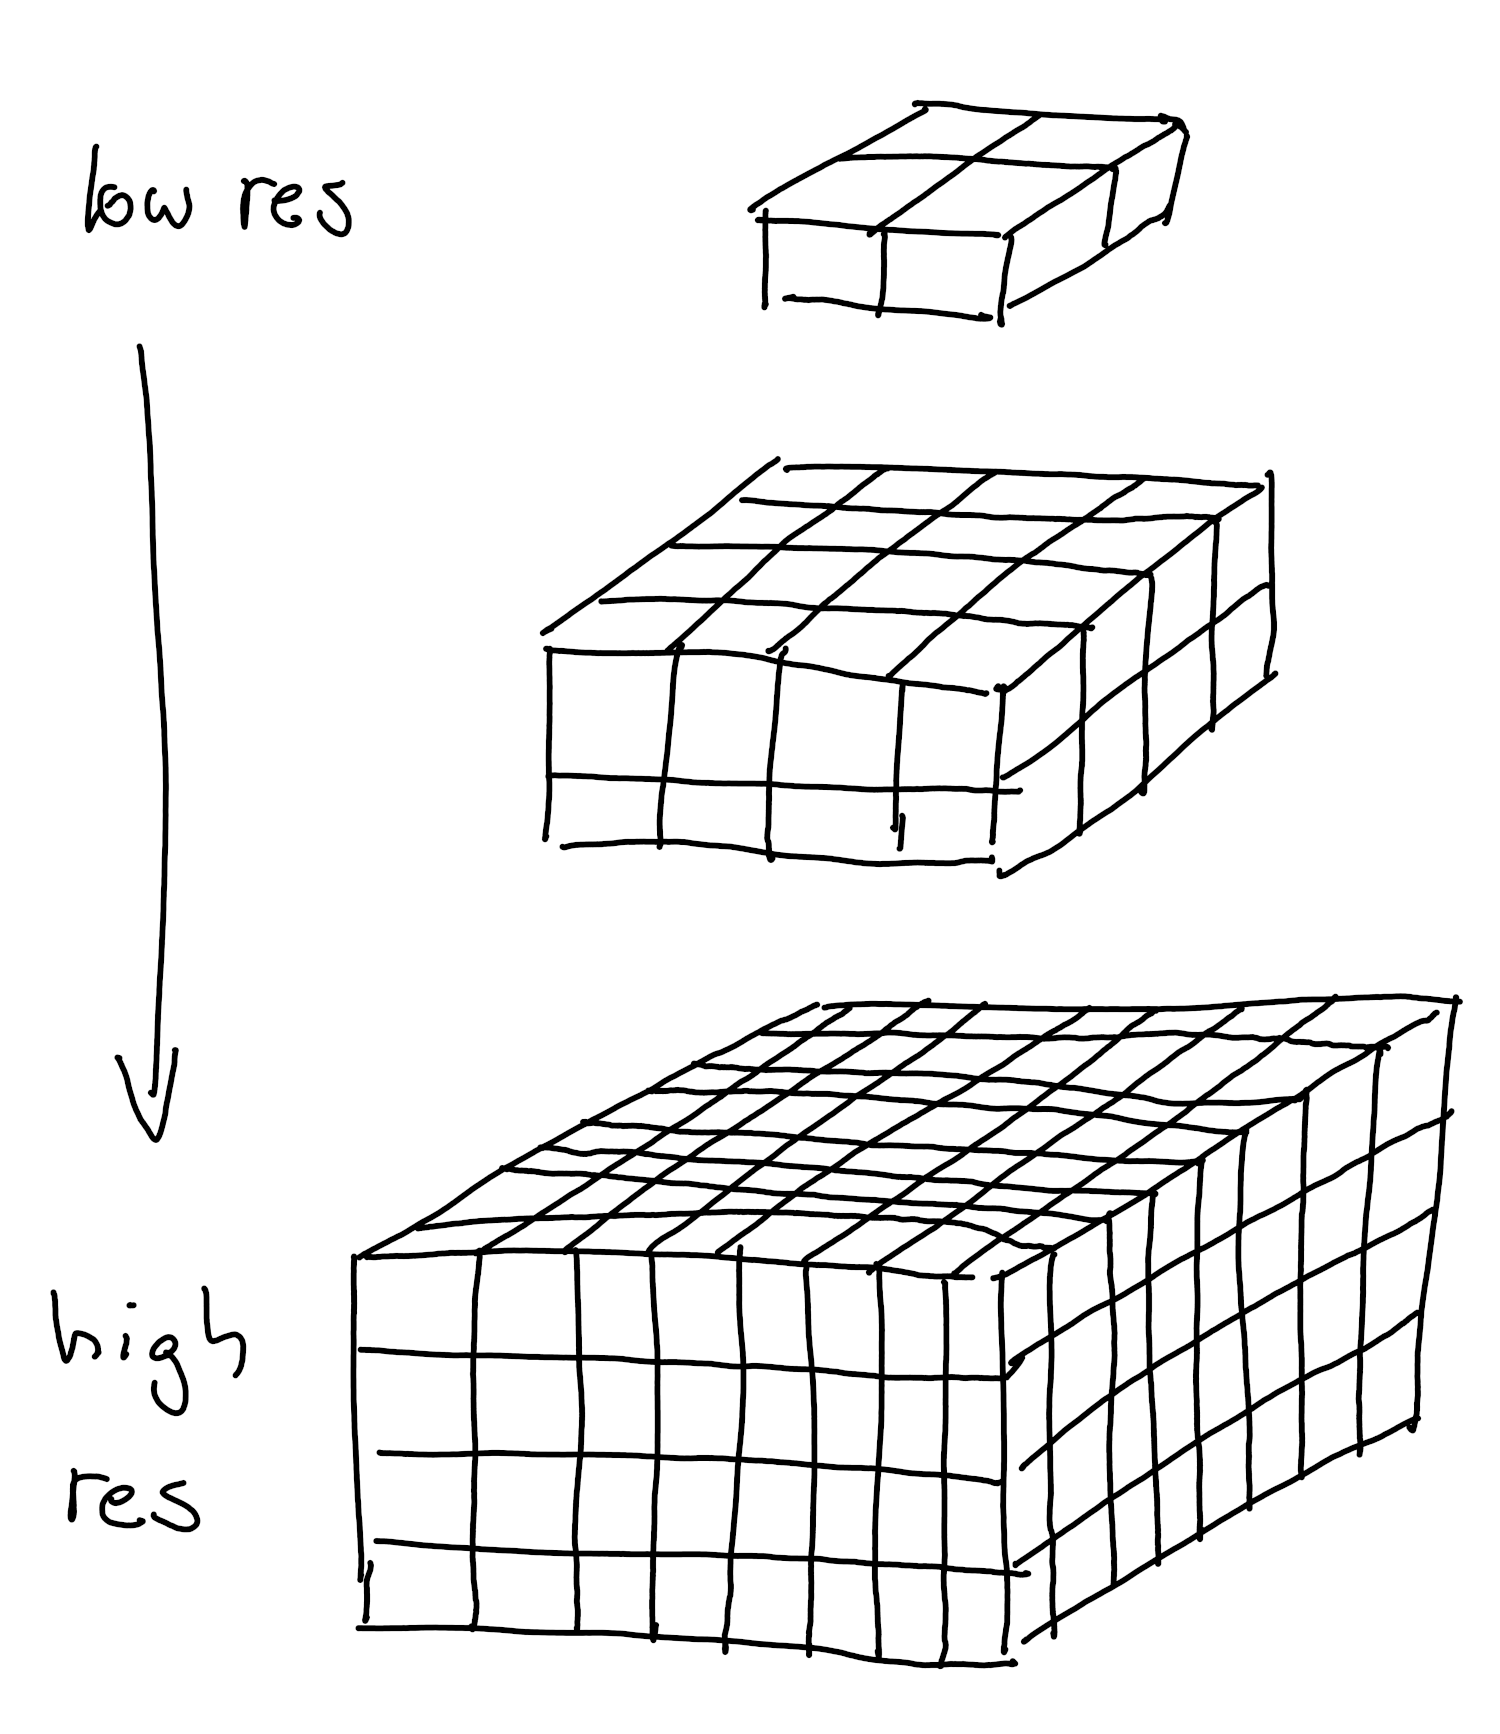
Why OME-ZARR? Image stored in chunks as files on disk Image stored in different resolutions Open Microscopy Environment specification format (OME-NGFF)
Visualizing volumetric datasets BigDataViewer Ecosystem Fiji is still choice number one for many who want to inspect an image quickly, mainly because it supports a vast
number of data formats. While Fiji can already render 3D data with its built in 3D Viewer, it also comes with
BigDataViewer (BDV), a great tool for arbitrary slicing of 3D data of any size. A whole ecosystem of tools based on BDV
has evolved over time, which we will explore in the tutorial linked below. Supports large data formats : The BDV ecosystem can handle massive 3D datasets and allow arbitrary slicing.Linked page not found: tutorial-volume-rendering-bdv
Visualizing volumetric datasets Web based rendering with Neuroglancer A web-based 3D viewer allows for interactive visualization directly in the browser without needing specialized software. These viewers can be embedded into web pages or shared with collaborators.
The following tutorial does not come with a full overview of existing web based viewers, but offers insight into a
project we are working on at MDC where we utilize Neuroglancer to display large scale mice brains online. Collaboration-friendly : Share URLs with collaborators to provide access to the 3D visualization.Linked page not found: tutorial-volume-rendering-neuroglancer
Visualizing volumetric datasets With the rise of popularity of Python as a script and programming language in the life sciences and beyond, let’s
look at Python based volumetric rendering in the tutorial linked below. We will look at Napari, Pygfx, and VTK. It
is worth mentioning that he last two tools are also great resources for rendering mesh based datasets. Meshes and point clouds are are irregularly structured and optimized for representing surfaces or discrete samples of geometry.
Point Clouds: Collections of discrete points in 3D space, often obtained directly from sensors (e.g., LiDAR, microscopes, drone scans). They represent raw spatial samples without explicit connectivity. 3D Dataset types Point Clouds
A set of discrete points in 3D space , each with coordinates (X, Y, Z) and optional attributes (intensity, color, normals, timestamps, ..).
Commonly acquired from:
LiDAR scanners (environment mapping)Microscopy & tomography (particle detection, molecule positions)Photogrammetry & drone scans (environment reconstruction)Rendering Challenges:
Lack of connectivity → needs surface reconstruction for continuous models. Often contains noise and redundancy → requires filtering, alignment, subsampling .
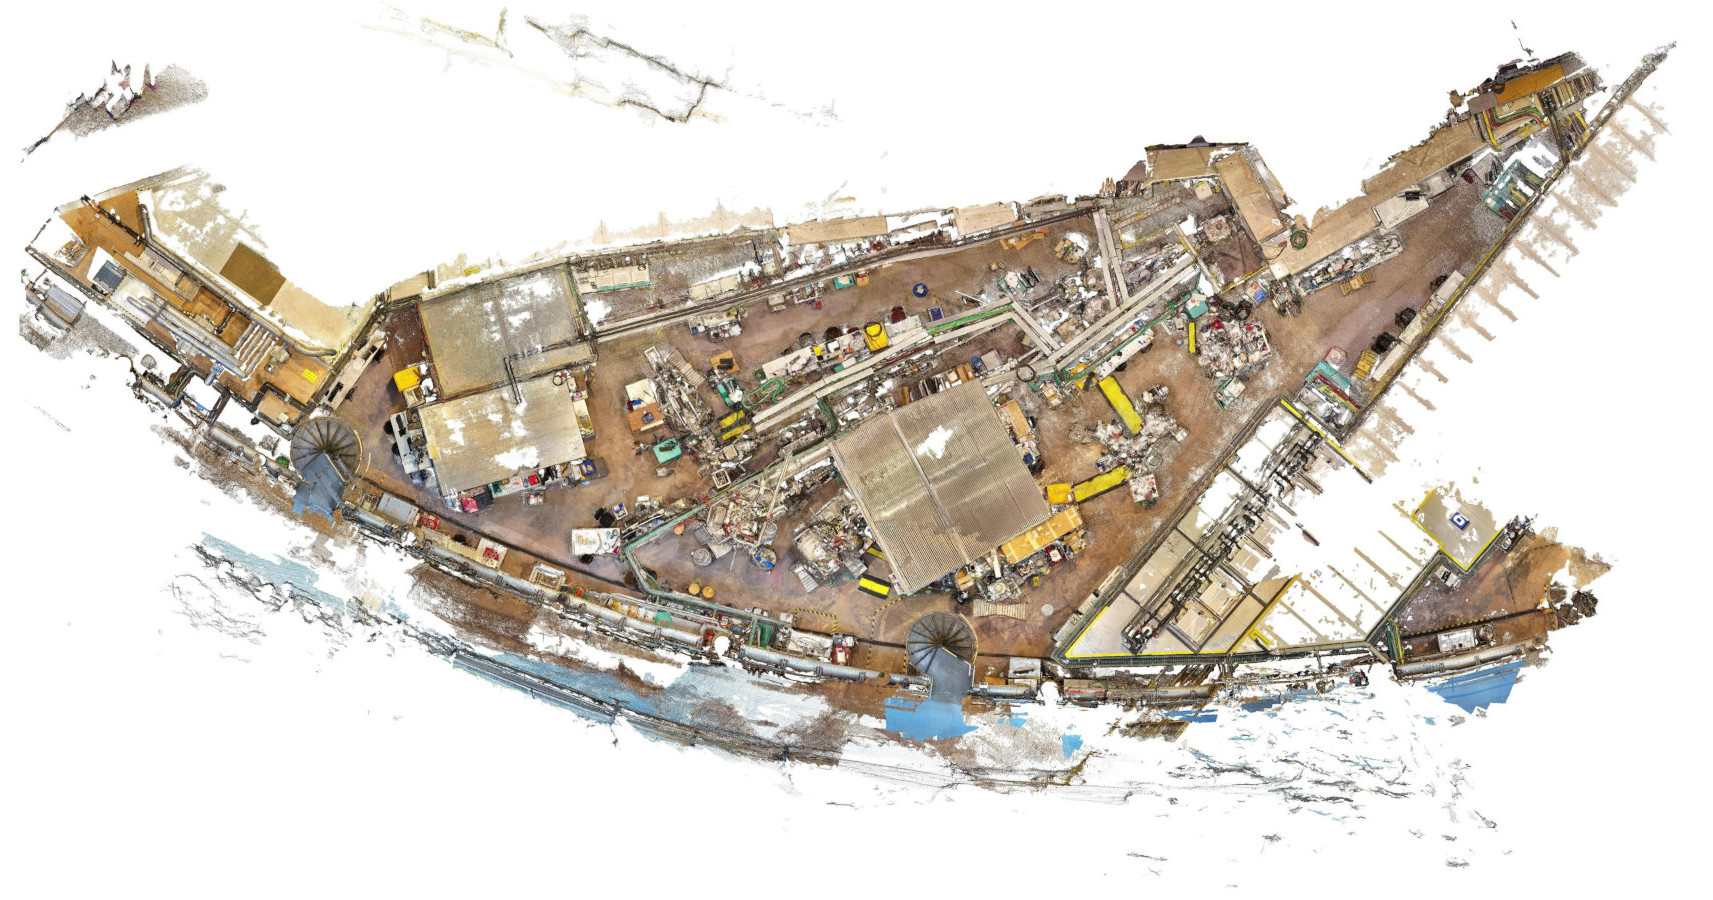
Project BESSY2 Reconstruction
Helmholtz Imaging Collaboration
Jan-Simon Schmidt (HZB), Ole Johannsen (DKFZ, Helmholtz Imaging), Deborah Schmidt (MDC, Helmholtz Imaging)
Experiments in BESSY II change regularly, making tracking those changes - e.g. for planning additional experiments - necessary. Common surveying techniques are laborious and offer unneeded accuracy. Thus, we provide a pragmatic solution where the status quo is reconstructed from drone video footage. The resulting 3D reconstruction can be rendered from above using orthogonal projection. Overlaying this rendering with the original 2D plans gives valuable information about the differences between the status quo and the theoretical plans. Project BESSY2 Reconstruction Extract point clouds from frames of drone video footage Clean & rotate, and merge point clouds (using CloudCompare )Render results in Blender for inspection & visualizationConvert to Potree format (multi resolution)Upload to public server → Accessible in browser with Potree (open-source WebGL based point cloud renderer for large point clouds)Point Clouds
Domain-Specific Variants Many scientific domains represent data as points in 3D space with domain-specific attributes.Atoms in molecules → standardized formats (PDB, mmCIF), rendered as spheres/bondsStars in astronomy → catalogs (FITS, VOTable), rendered as brightness-colored pointsCells in microscopy → tables or SWC/OME formats, rendered as centroids or markers Same principles apply, but with tailored formats & rendering techniques
Across domains, point clouds represent very different entities, but always follow the same idea: a collection of points with attributes. What changes are the formats used to store them and the rendering techniques adapted to each scientific field. 3D Dataset types Meshes Meshes: Networks of vertices, edges, and faces describing a continuous surface. They are ideal for modeling and rendering shapes and boundaries.
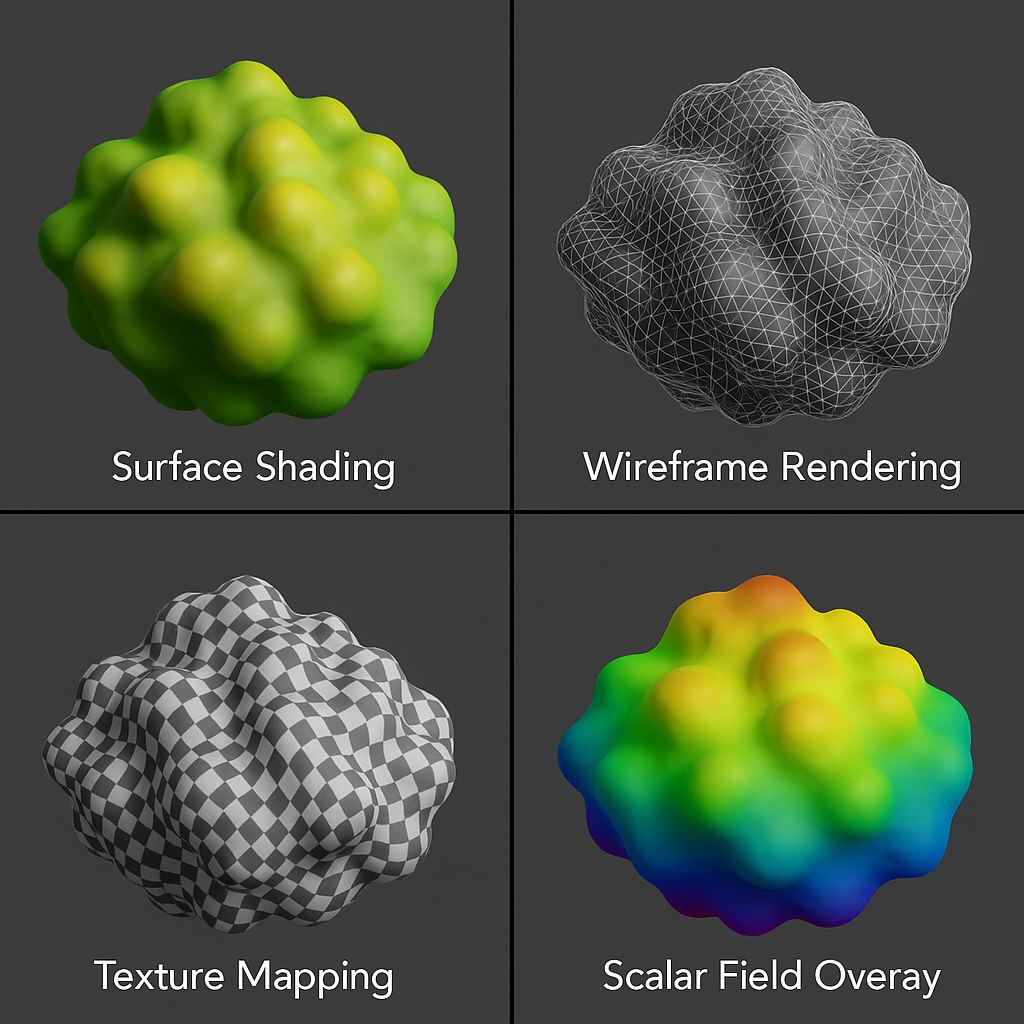
Represent surfaces of objects (not interiors). Built from vertices, edges, and faces (usually triangles). Compact representation compared to voxels → ideal for storing geometry . Visualization techniques: surface shading, wireframe rendering, texture mapping, scalar field overlays .
Meshes excel when surface properties are more important than volume. They allow computation of curvature, surface area, or mapping of experimental data onto geometry. Converting volumetric datasets into meshes For scientific visualization, meshes are often extracted from volumetric datasets and then analyzed or rendered.
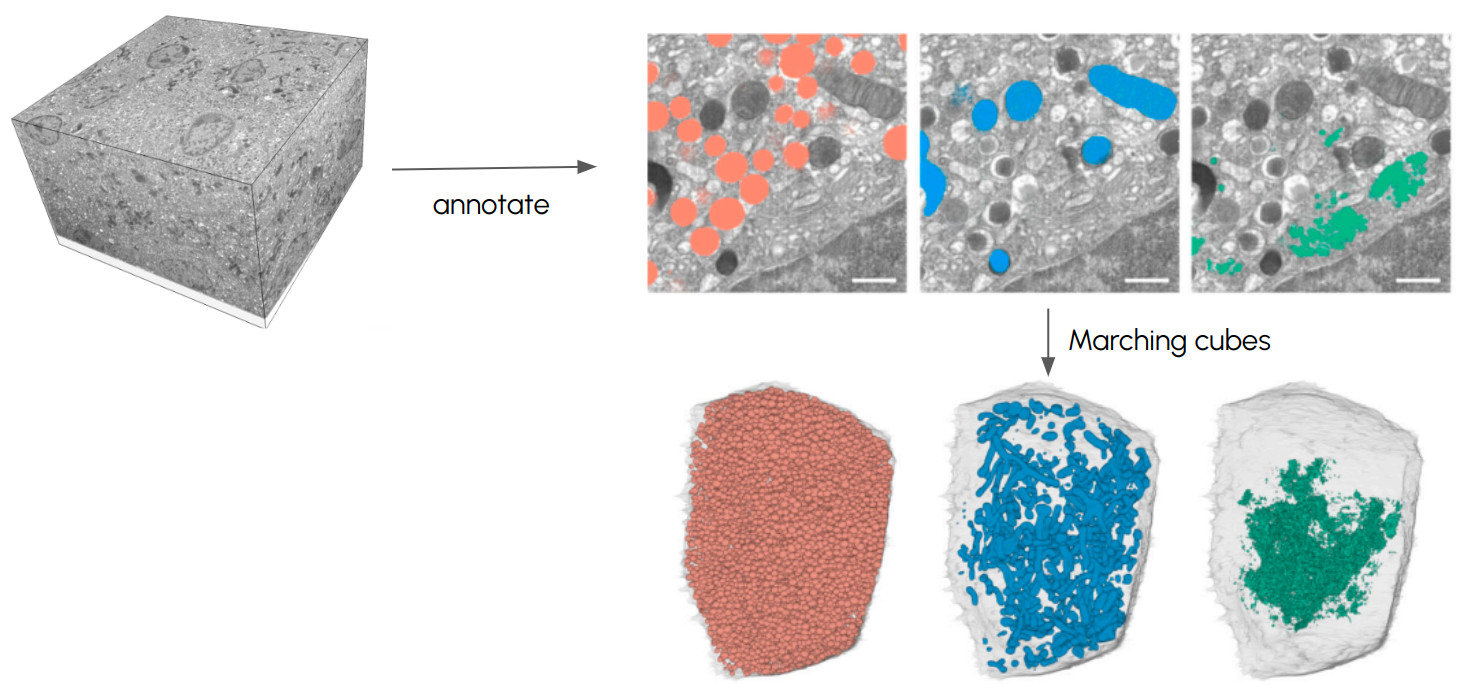
Annotations can be used to add specific information to volumetric datasets, such as marking points of interest (e.g., cell locations, regions of interest) or segmenting areas of the data. Converting these annotated datasets into meshes allows for the visual representation of those specific features.
When converting volumetric data to meshes , it’s necessary to draw concrete borders between the foreground (the object of interest) and the background . This is achieved through:
Fixed thresholds : Used to generate meshes by separating foreground from background using a set intensity threshold.Content-based annotations : Create precise meshes by using annotated regions to define boundaries.Machine learning & interactive labeling : Interactive tools combine user input with AI predictions to refine boundaries.
Converting volumetric datasets into meshes Marching Cubes The Marching Cubes algorithm is one of the most popular methods for extracting a 3D surface from volumetric data. It identifies the points in a voxel grid where the dataset crosses a specific threshold value (the isosurface ) and uses those points to generate a mesh. Marching cubes algorithm. Credit: Ryoshoru, Jmtrivial on Wikimedia , CC BY-SA 4.0
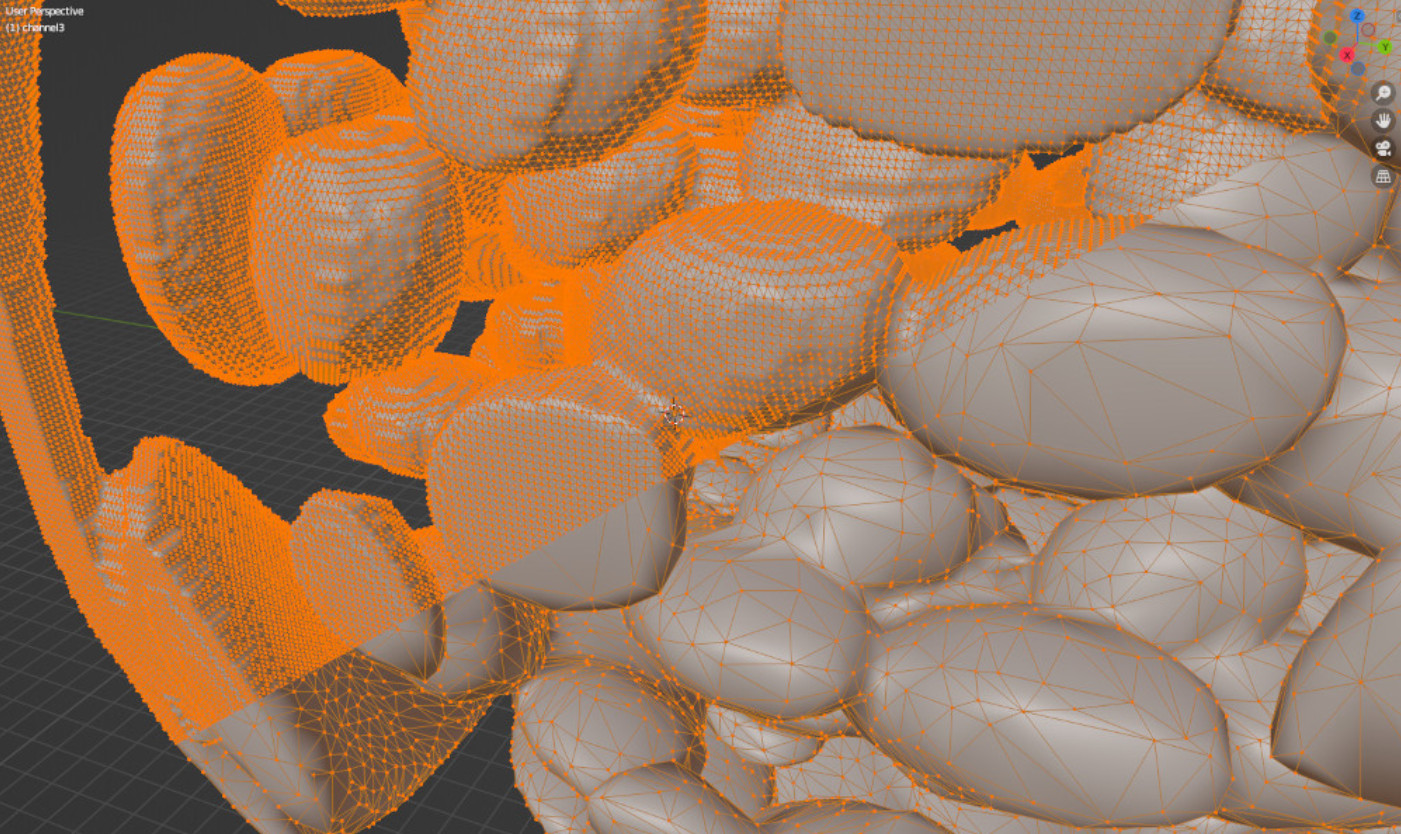
Converting volumetric datasets into meshes Optimization Binary masks vs. Probability maps When converting volumetric data to meshes, optimizing the output is crucial for achieving smooth and accurate
results. One good approach is using probability maps rather than binary masks as input for the Marching Cubes
algorithm .
Binary masks : Create rough, blocky meshes because the data is thresholded into hard 0/1 values, losing subpixel detail.Probability maps : Offer smoother results, as the algorithm can detect gradients between regions, improving mesh precision at subpixel levels.Converting volumetric datasets into meshes Conversion scripts While several tools include converting volumetric datasets into meshes, VTK has worked particularly well in our
experience. Check out the tutorial below for more details. This includes Python code snippets, but also the
possibility to run conversion through a graphical user interface or command line using an Album solution. Linked page not found: tutorial-mesh-conversion
Mesh processing Reducing mesh complexity Large, complex meshes can be computationally intensive to render. Reducing mesh complexity helps with performance, especially for web viewers or real-time visualization. We’ll explore some standard techniques to simplify meshes while maintaining critical details.
Decimation : A process to reduce the number of polygons in a mesh while maintaining the overall shape and detail.Remeshing : Tools like MeshLab and Blender offer remeshing techniques that can optimize mesh topology for better performance.LOD (Level of Detail) : Use LOD techniques to switch between different levels of mesh complexity based on the viewer’s distance.
Mesh processing Once a mesh is generated from a volumetric dataset, further processing may be necessary to refine the mesh for better performance, rendering, or analysis. One of the most popular tools for mesh processing is MeshLab , an open-source application for cleaning, repairing, and optimizing 3D meshes. MeshLab : A powerful tool for cleaning, decimating, and refining 3D meshes. It supports:
Smoothing : Remove sharp edges or rough areas in the mesh.Decimation : Reduce the number of polygons while maintaining the overall shape.Repair : Fix holes or non-manifold geometry in the mesh for better usability.Other tools : Blender and VTK also offer additional mesh processing capabilities.
Rendering meshes involves converting mesh data into visually meaningful images, taking into account surface
properties, lighting, and camera angles. Spending time on rendering approaches matching your use case is a way of
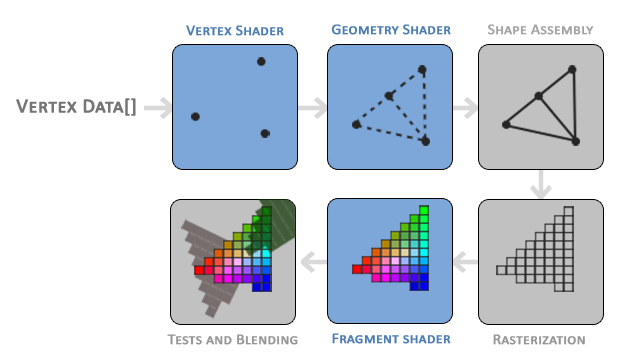
defining how to tell the story of your dataset. Rendering meshes Rendering pipeline In 3D rendering , the graphics pipeline is responsible for transforming 3D coordinates into 2D pixels on the screen. This process involves several stages, where each step takes the output from the previous stage and prepares the data for the next. The pipeline efficiently transforms vertex data into pixels using shaders , small programs that run on the GPU to accelerate rendering. The pipeline can be divided into two main parts: geometry processing (converting 3D coordinates into 2D) and fragment processing (turning 2D data into colored pixels).
Vertex Shader : Transforms 3D coordinates and applies basic vertex processing.Geometry Shader (optional): Generates new geometry from existing primitives.Fragment Shader : Computes the final color of each pixel.Blending and Depth Testing : Determines how pixels are blended and which ones are visible.Credit: Joey de Vries,https://learnopengl.com/, CC BY 4.0
Rendering meshes Rendering meshes with VTK VTK offers extensive tools for rendering meshes, allowing for the customization of surface properties and lighting to achieve the desired visualization. This tutorial will guide you through setting up a rendering pipeline in VTK, from loading meshes to final visualization. VTK rendering features : Customize surface properties like color, opacity, and lighting. VTK can also handle interactive rendering, where users can rotate and zoom in on the rendered mesh.Linked page not found: tutorial-mesh-rendering-vtk
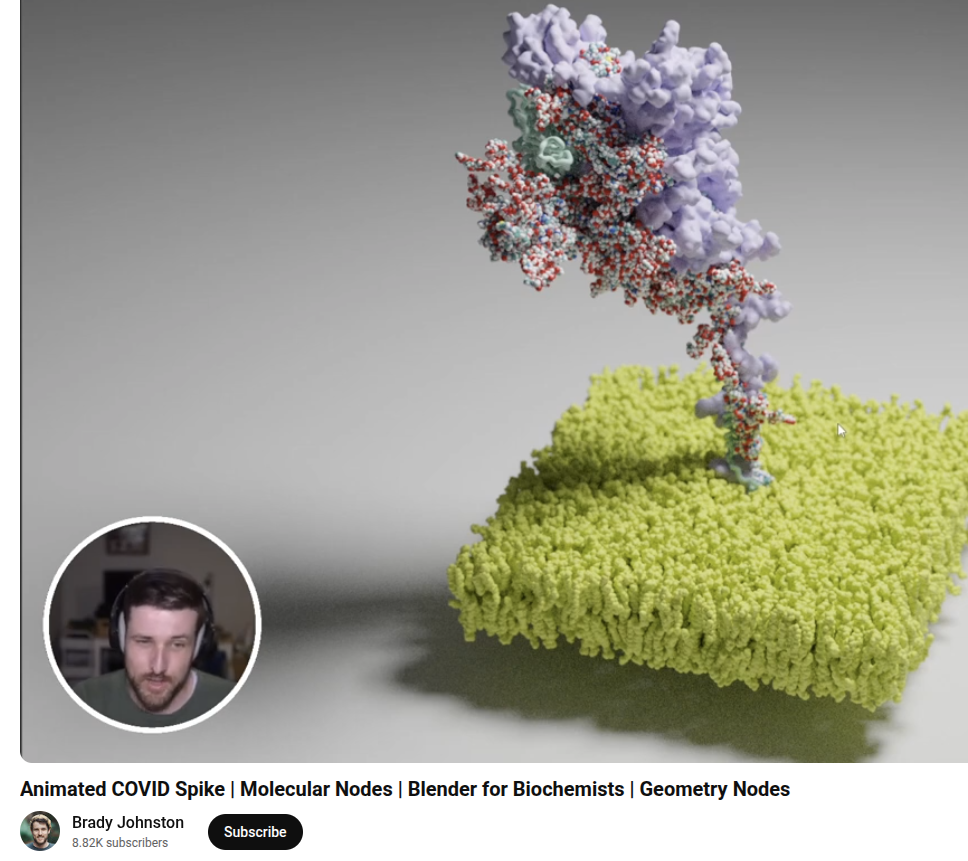
Rendering meshes Rendering meshes with Blender Blender is a powerful open-source tool for rendering meshes. It supports realistic rendering, including lighting, shadows, transparency, and advanced surface textures. In this tutorial, you will learn how to set up Blender to render scientific datasets as meshes. Linked page not found: tutorial-mesh-rendering-blender
Rendering meshes Cutting volumes in Blender Blender’s powerful modeling and sculpting tools allow users to cut and manipulate 3D meshes. In this section, we’ll cover techniques for cutting volumes to expose internal structures or focus on specific regions.
Cutting meshes : Use Blender’s Boolean modifier to subtract volumes and expose internal structures.Focus on regions : Cut specific parts of the mesh to highlight or reveal hidden features inside the object.Linked page not found: tutorial-mesh-cutting-volumes-blender
Choosing colors Choosing the right colors for your 3D visualizations is crucial for enhancing clarity and understanding. The
tutorial below guides you through color representation in digital programs, a brief look into existing colormaps,
and a few more tricks for picking the best colors for your project. Don’t underestimate the impact of choosing colors matching your story! Linked page not found: tutorial-choosing-colors
Ongoing challenges and opportunities In the future, we anticipate several areas of interest for 3D data visualization. These include advancements in web-based rendering tools, higher throughput for processing large datasets, and improvements in automation and dimensionality reduction.
Web based viewers High Throughput Automated workflows Dimensionality reduction Would you be interested in more specific tutorials? Thank you for attending this workshop. Feel free to reach out for further assistance or to explore
more visualization techniques!
Helmholtz Imaging Units at DESY, DKFZ, and MDC.


