Vector Field Visualization

Vector Field Visualization
NASA’s Perpetual Ocean
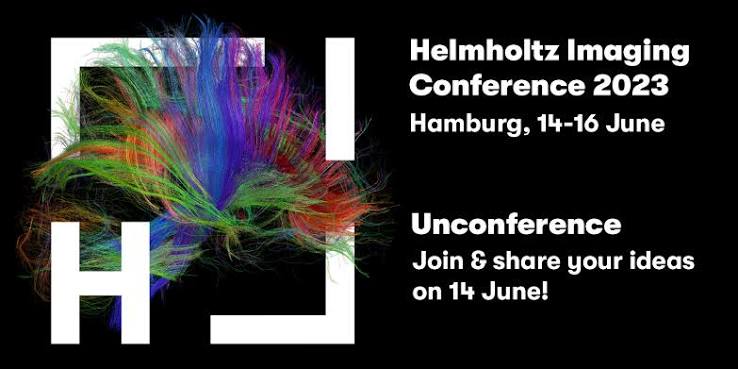
A Vector Field, Rendered as Fur
Each Point in Space
Has a Vector Value - Direction and Magnitude

A scalar field has one number per point.
A vector field has a direction and a magnitude at every point - wind, blood flow, a magnetic field, an ocean current.
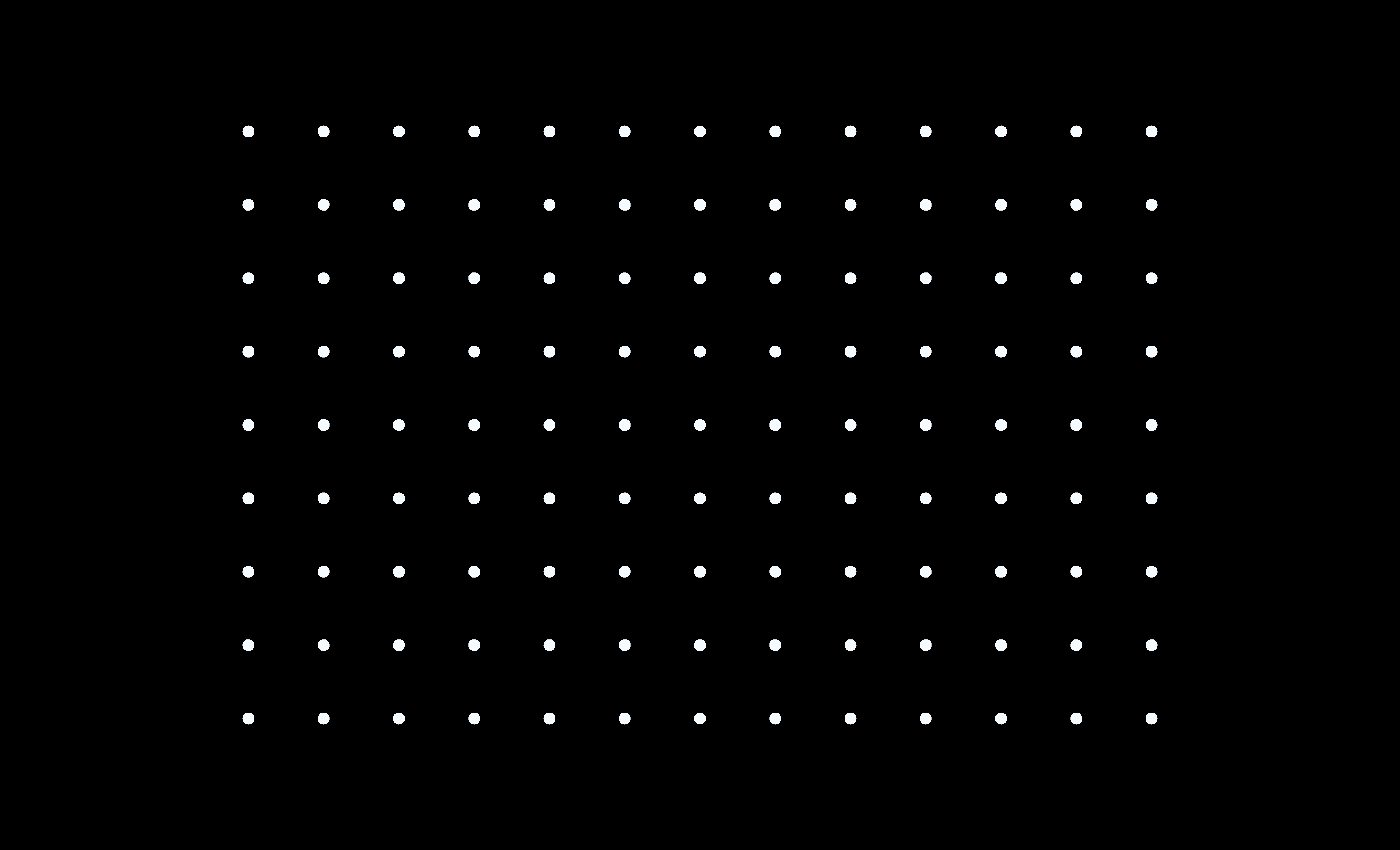
A point cloud
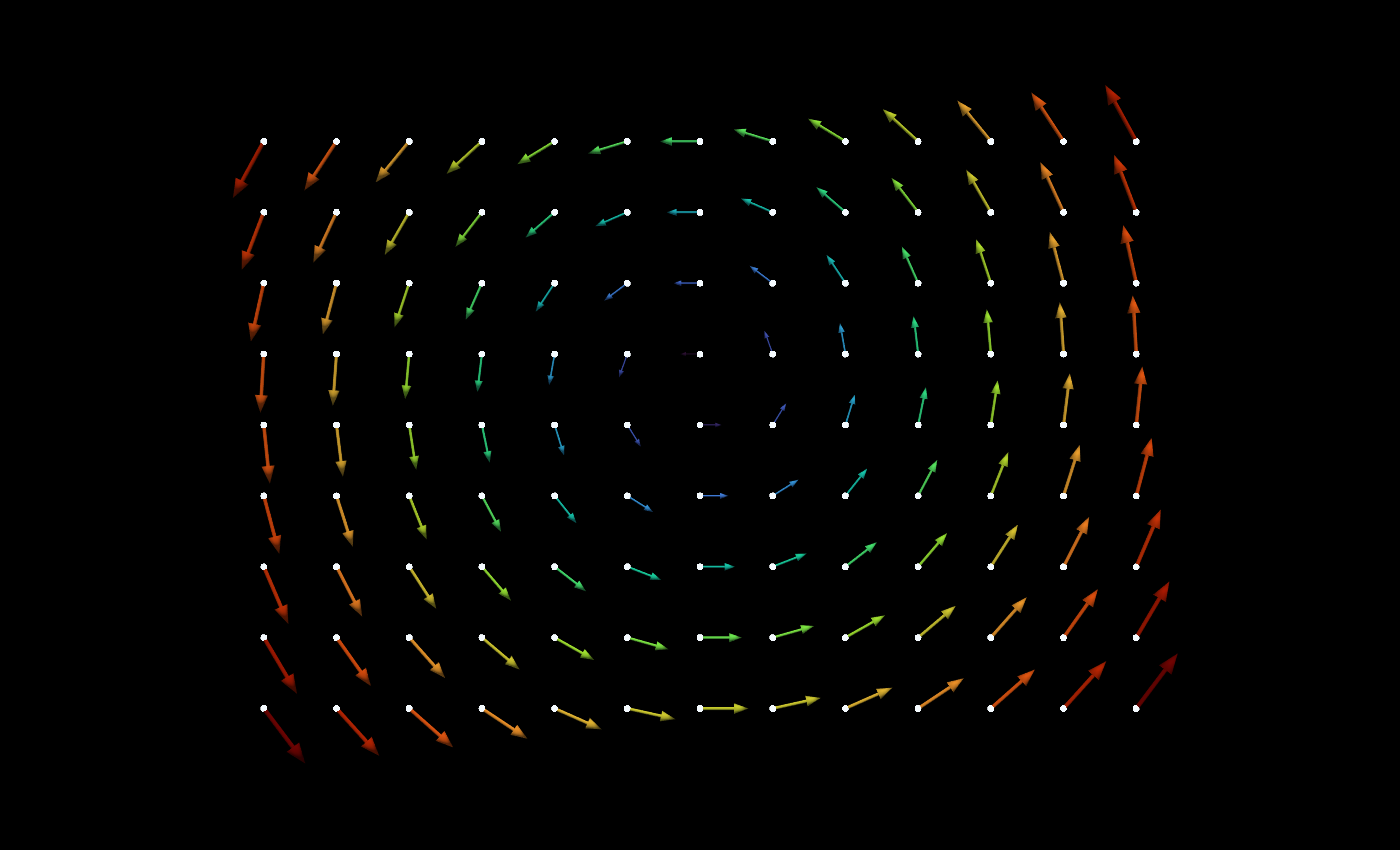
The same points, with a vector attached to each
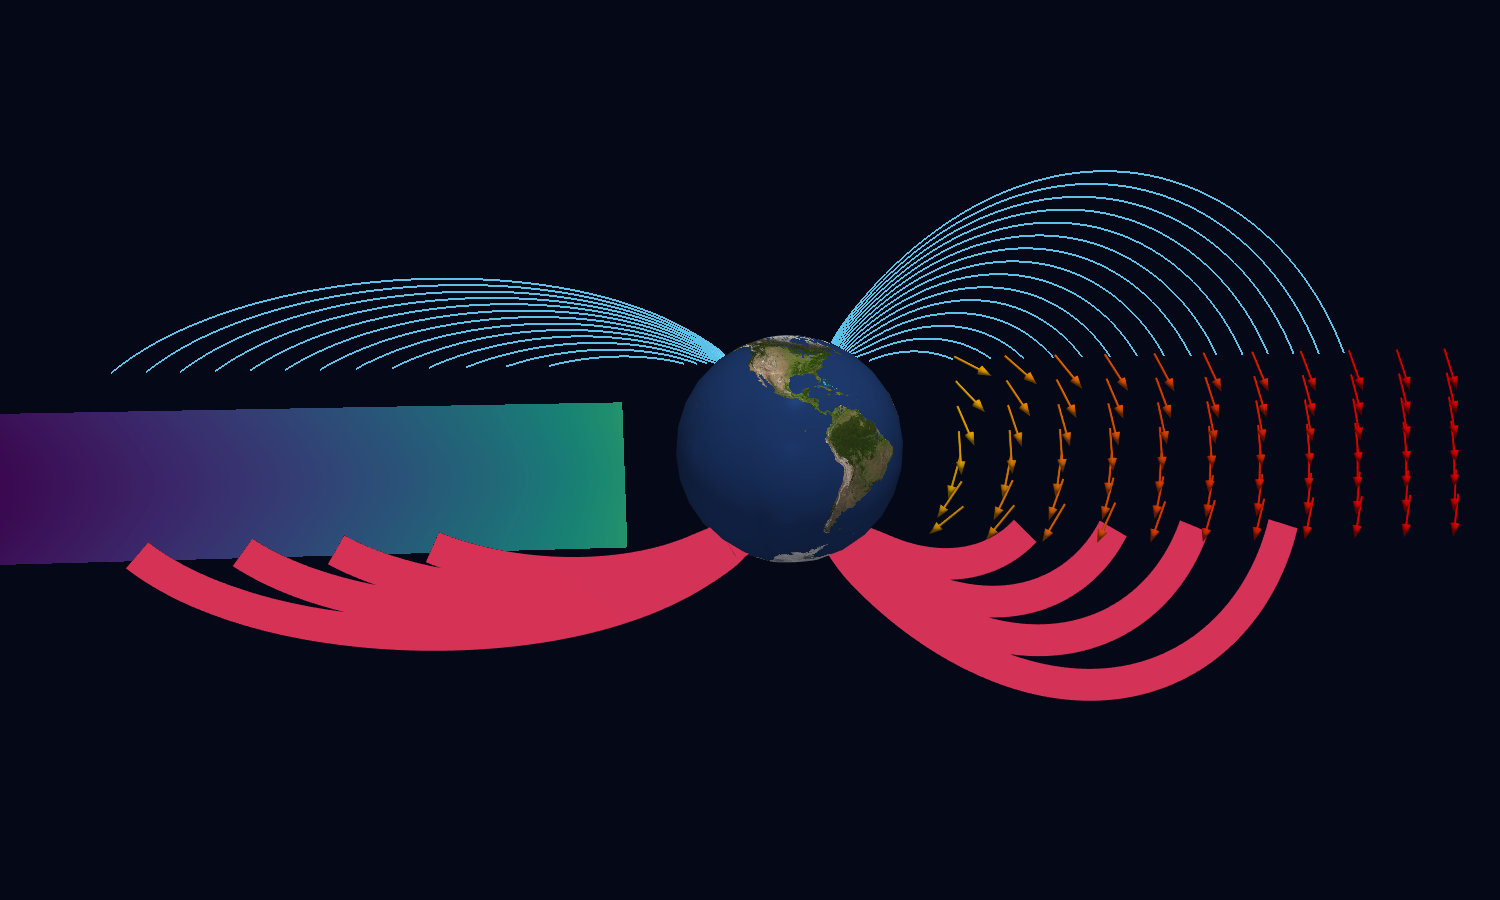
Our Goal: A Tailored Visualization
Van Allen Belt Simulation
- Full notebook: vector_field_visualization.ipynb
Visualization Types
Glyphs, Streamlines, Ribbons, Isolines
Vector Field as Scalar
Usually as a Heatmap
Visualize any scalar derived from a vector field:
- Magnitude
- Vorticity
- Curvature
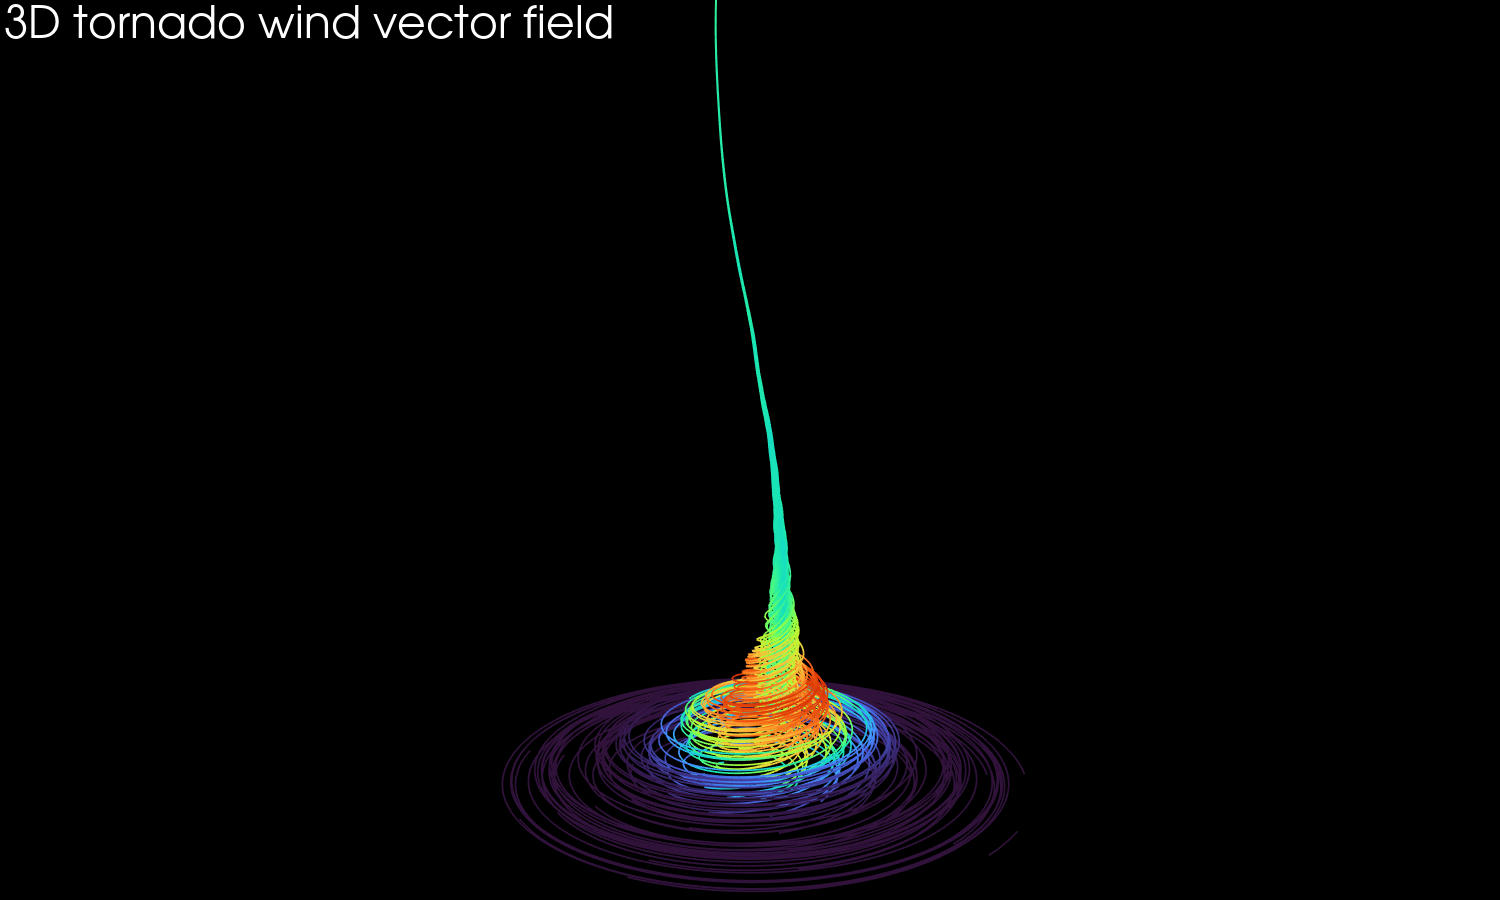
The underlying 3D wind vector field
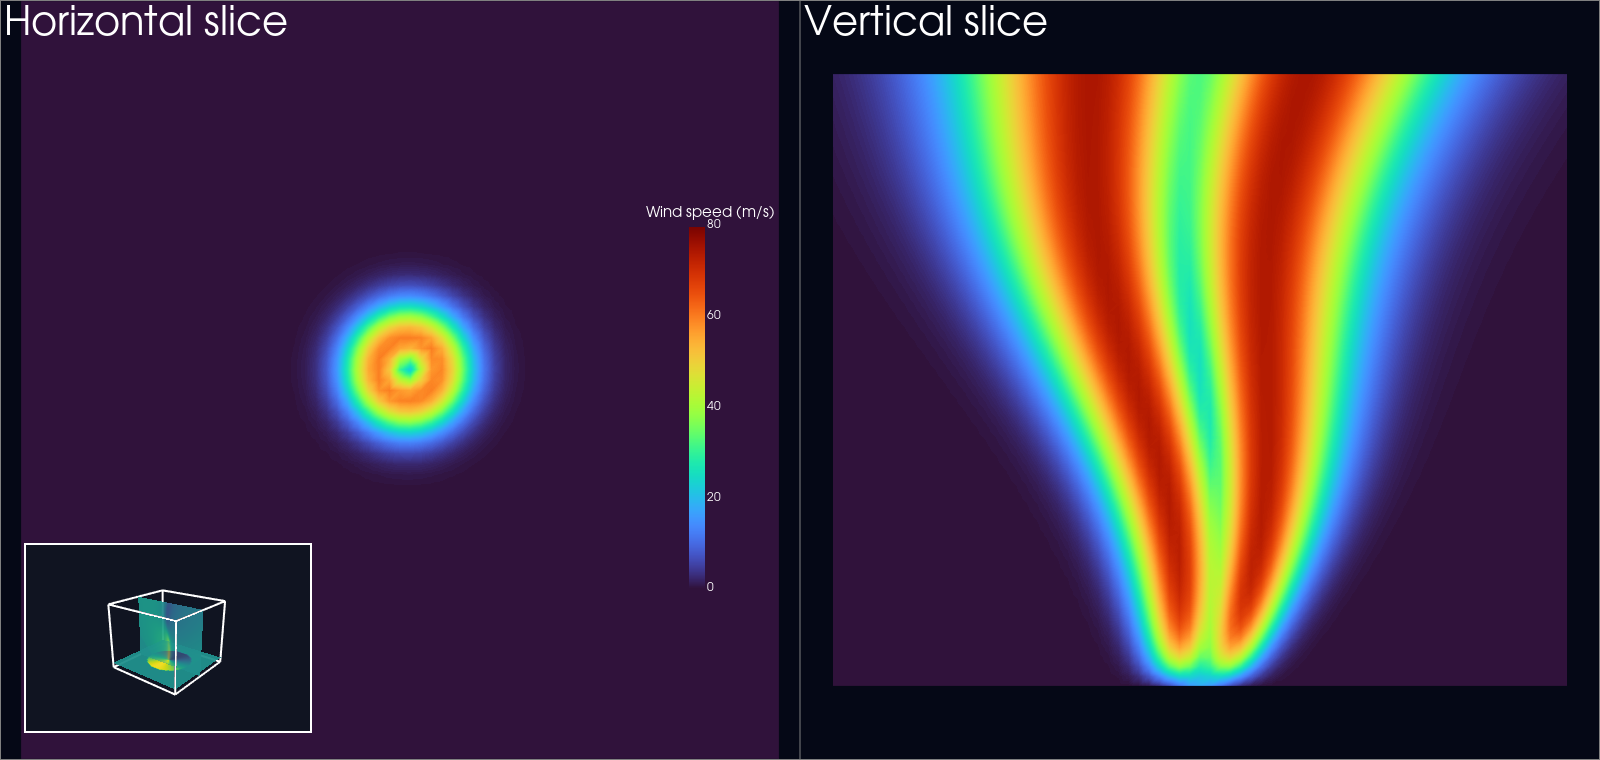
Magnitude on one horizontal, one vertical slice
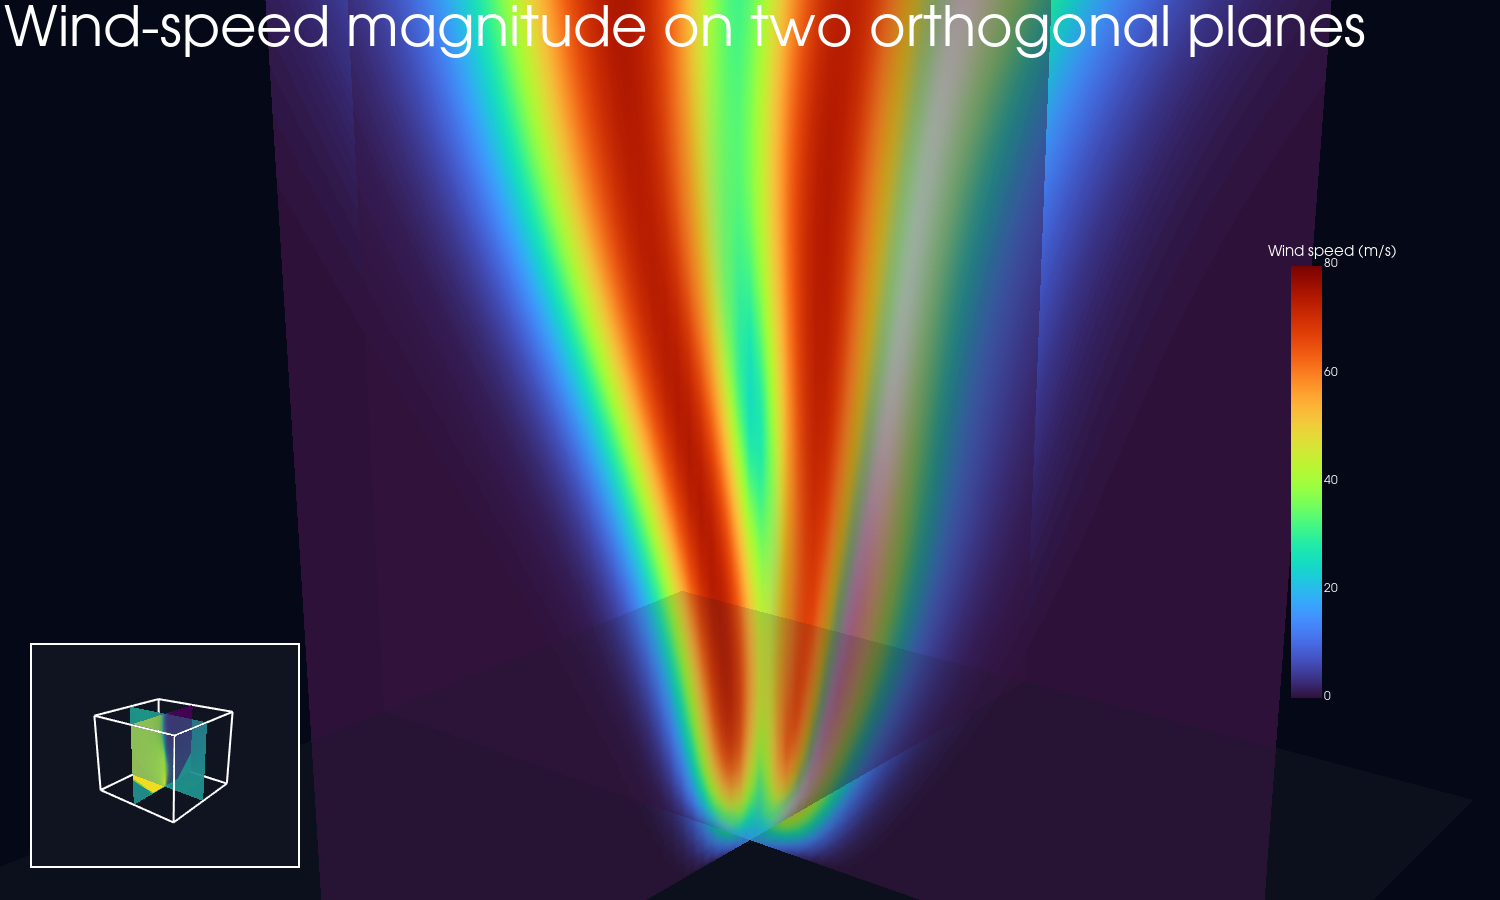
Magnitude on two orthogonal planes
Visualize 1 plane · 2 planes (here orthogonal) · 3D with opacity…
Vector Field as Glyphs
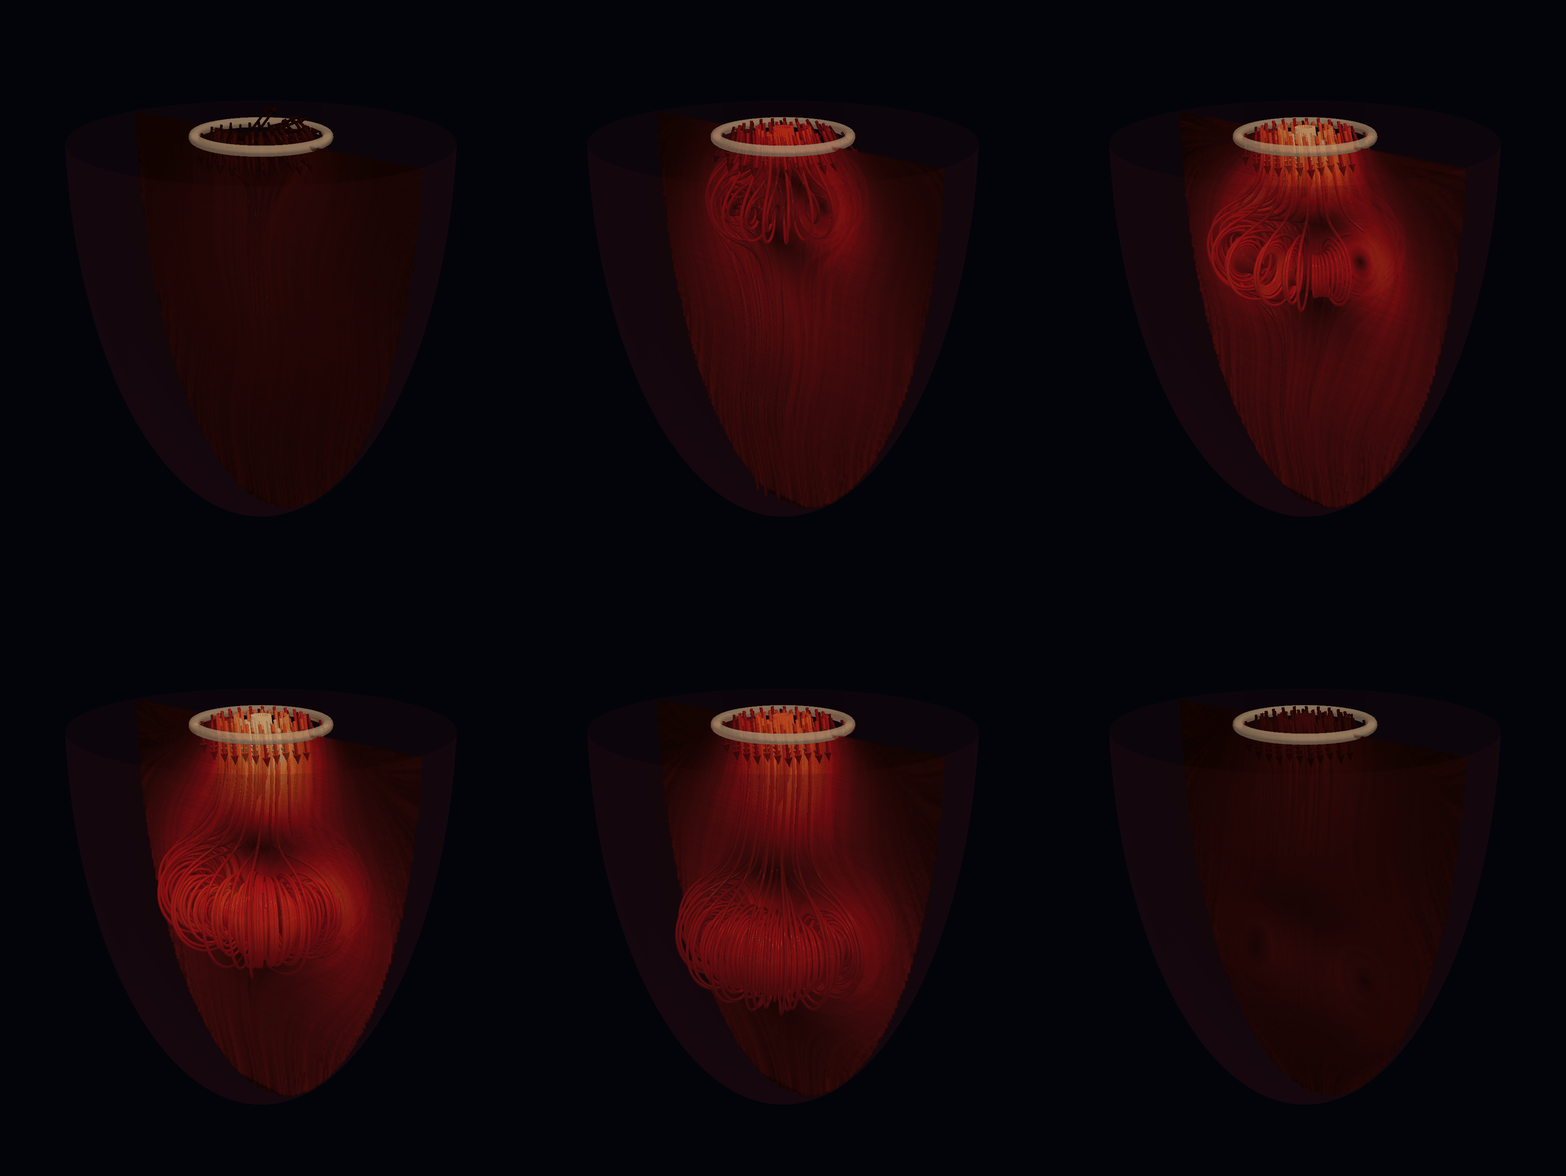
Blood Flow Simulation
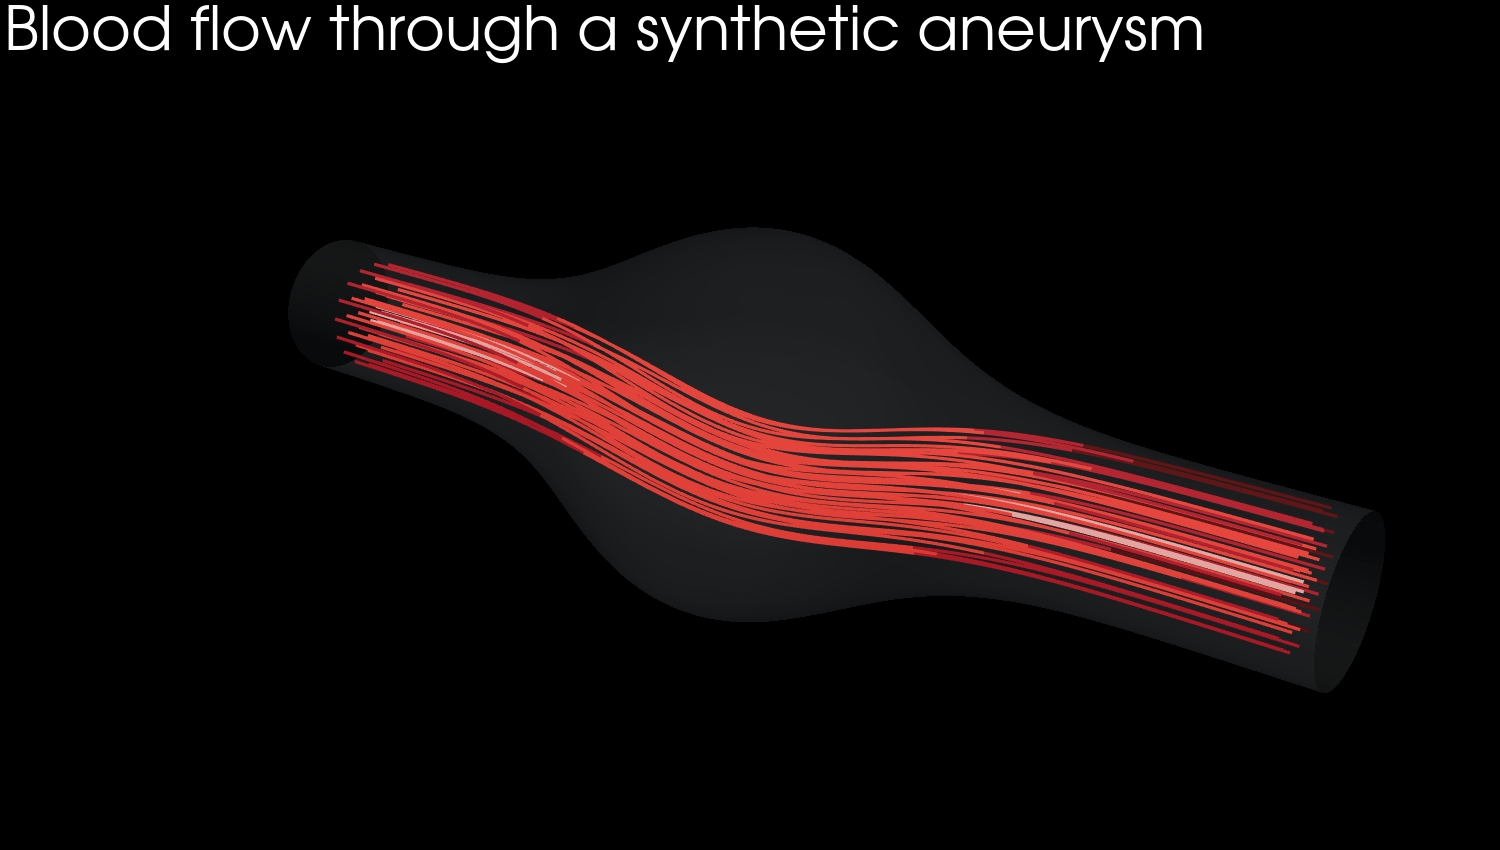
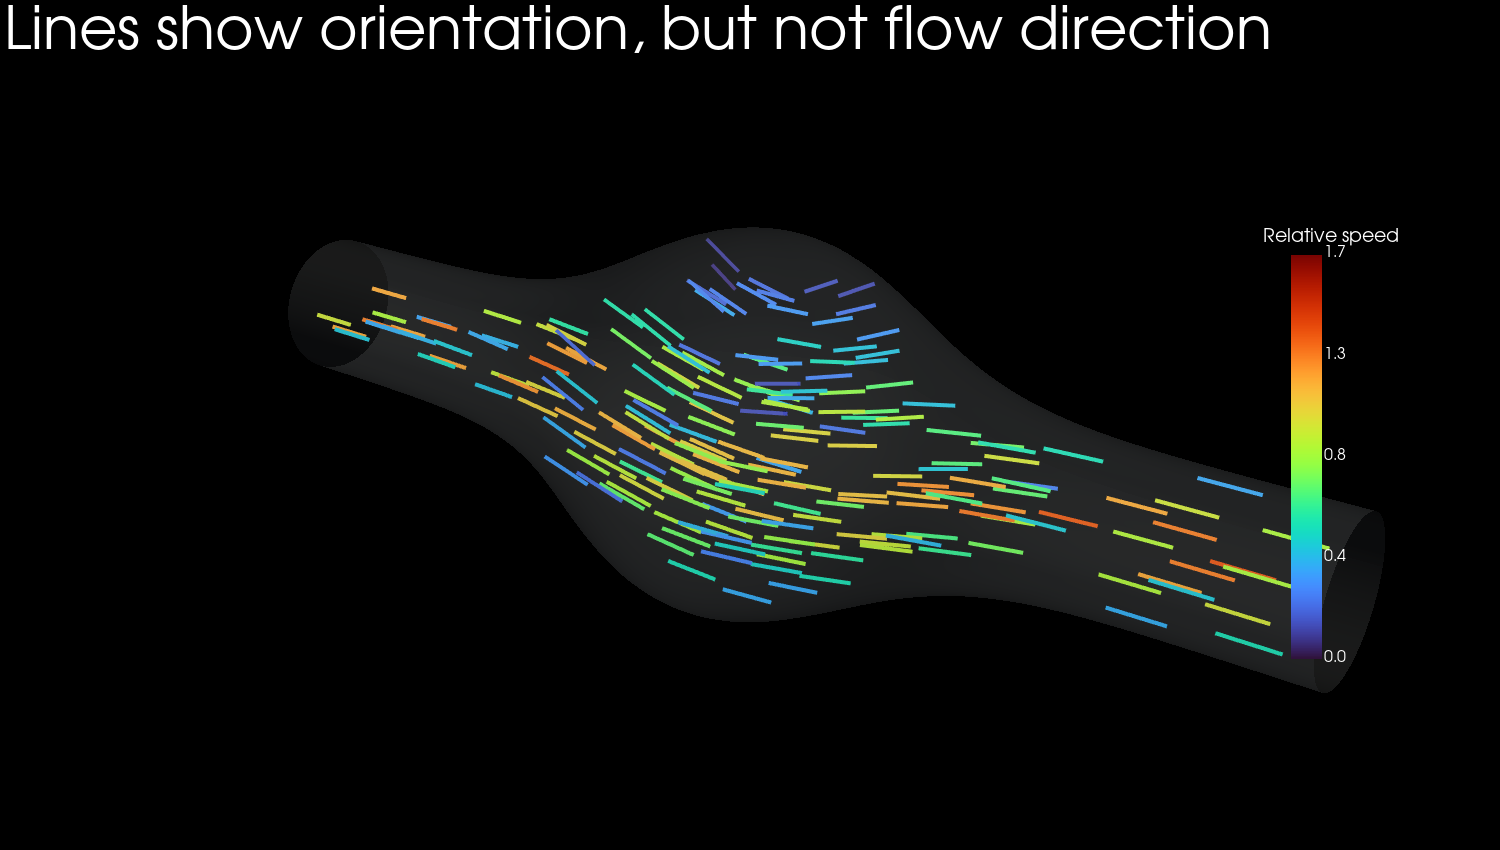
Lines - show orientation, but not flow direction
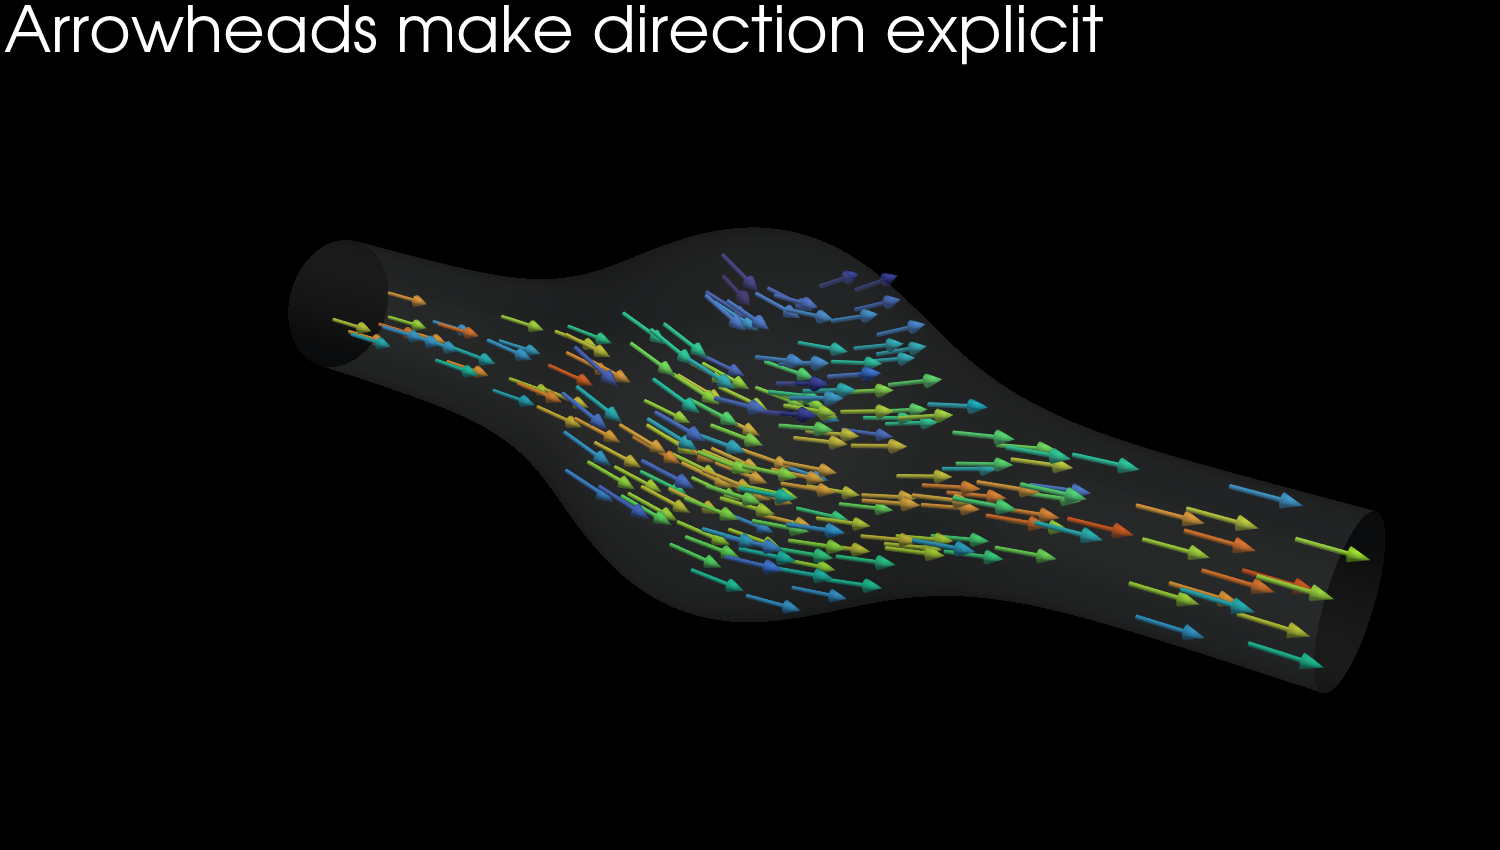
Arrows - arrowheads make direction explicit
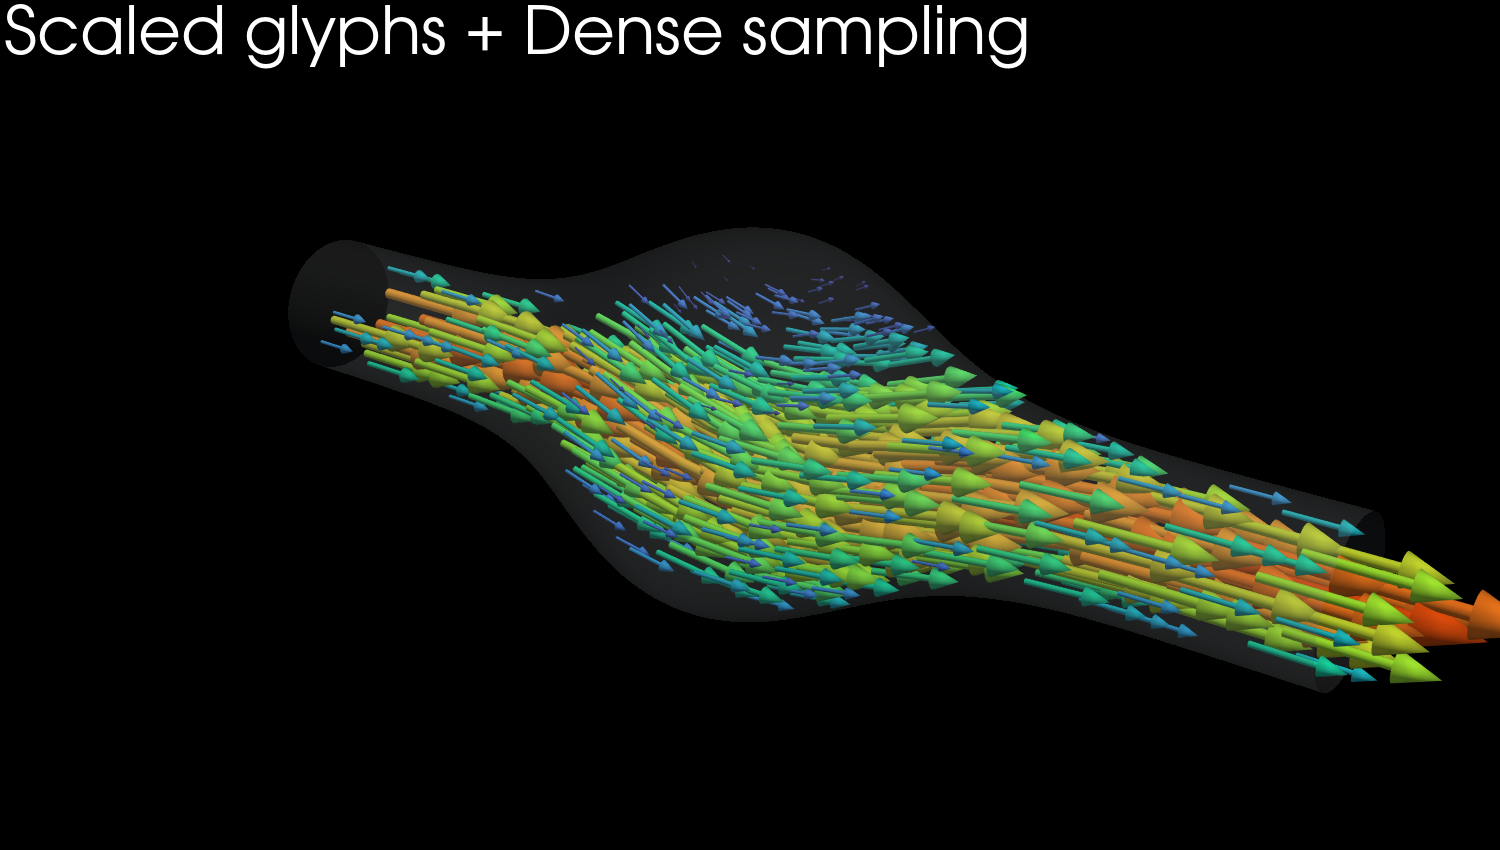
Too dense - scaled glyphs + dense sampling
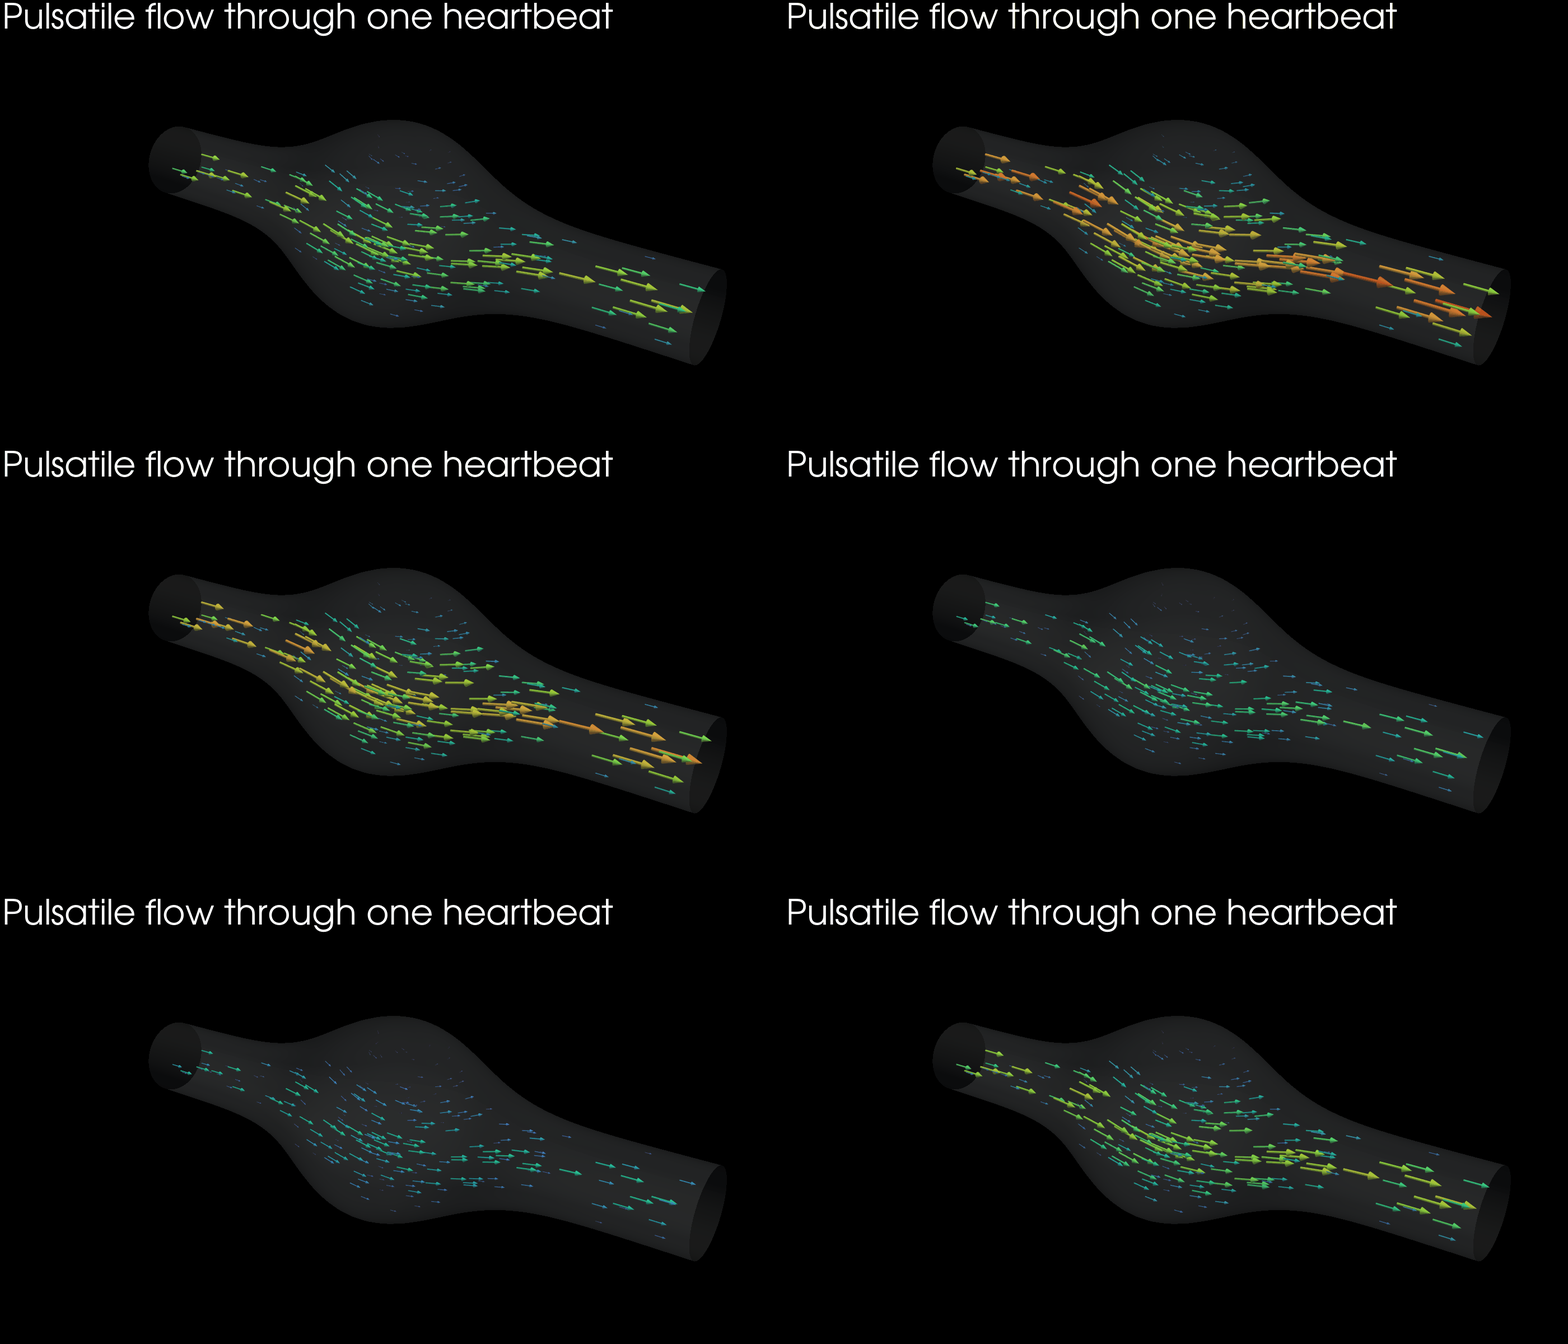
3D + time - pulsatile flow through one heartbeat
Vector Field as Streamlines
Yield Smooth and Continuous Curves
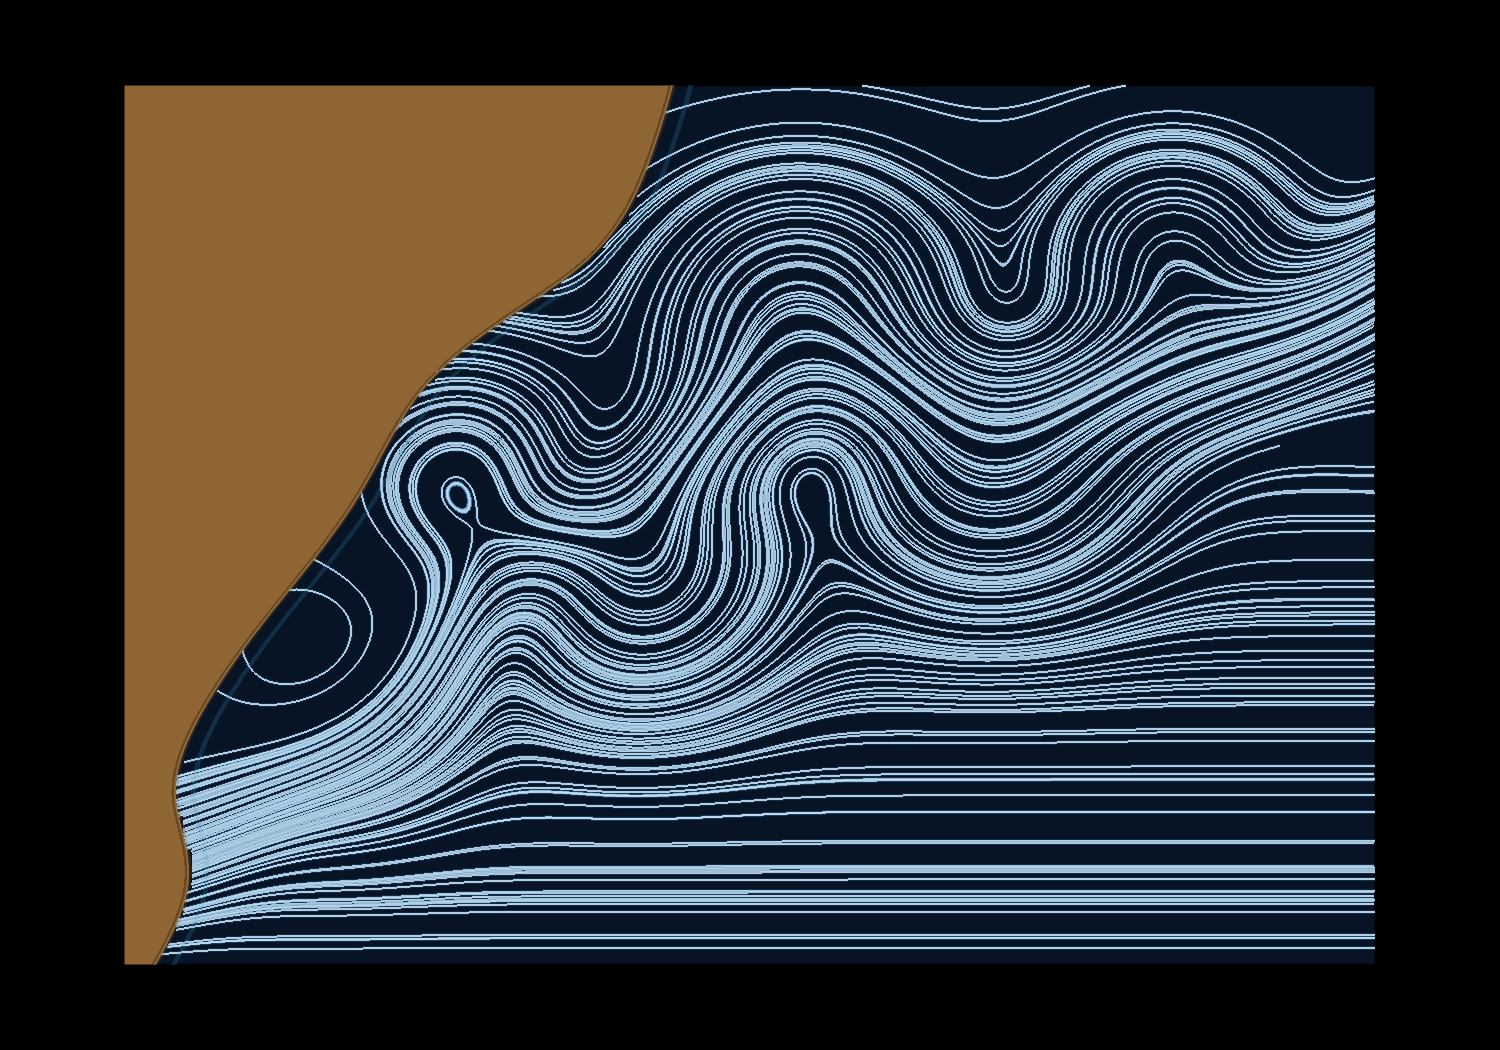
Dense
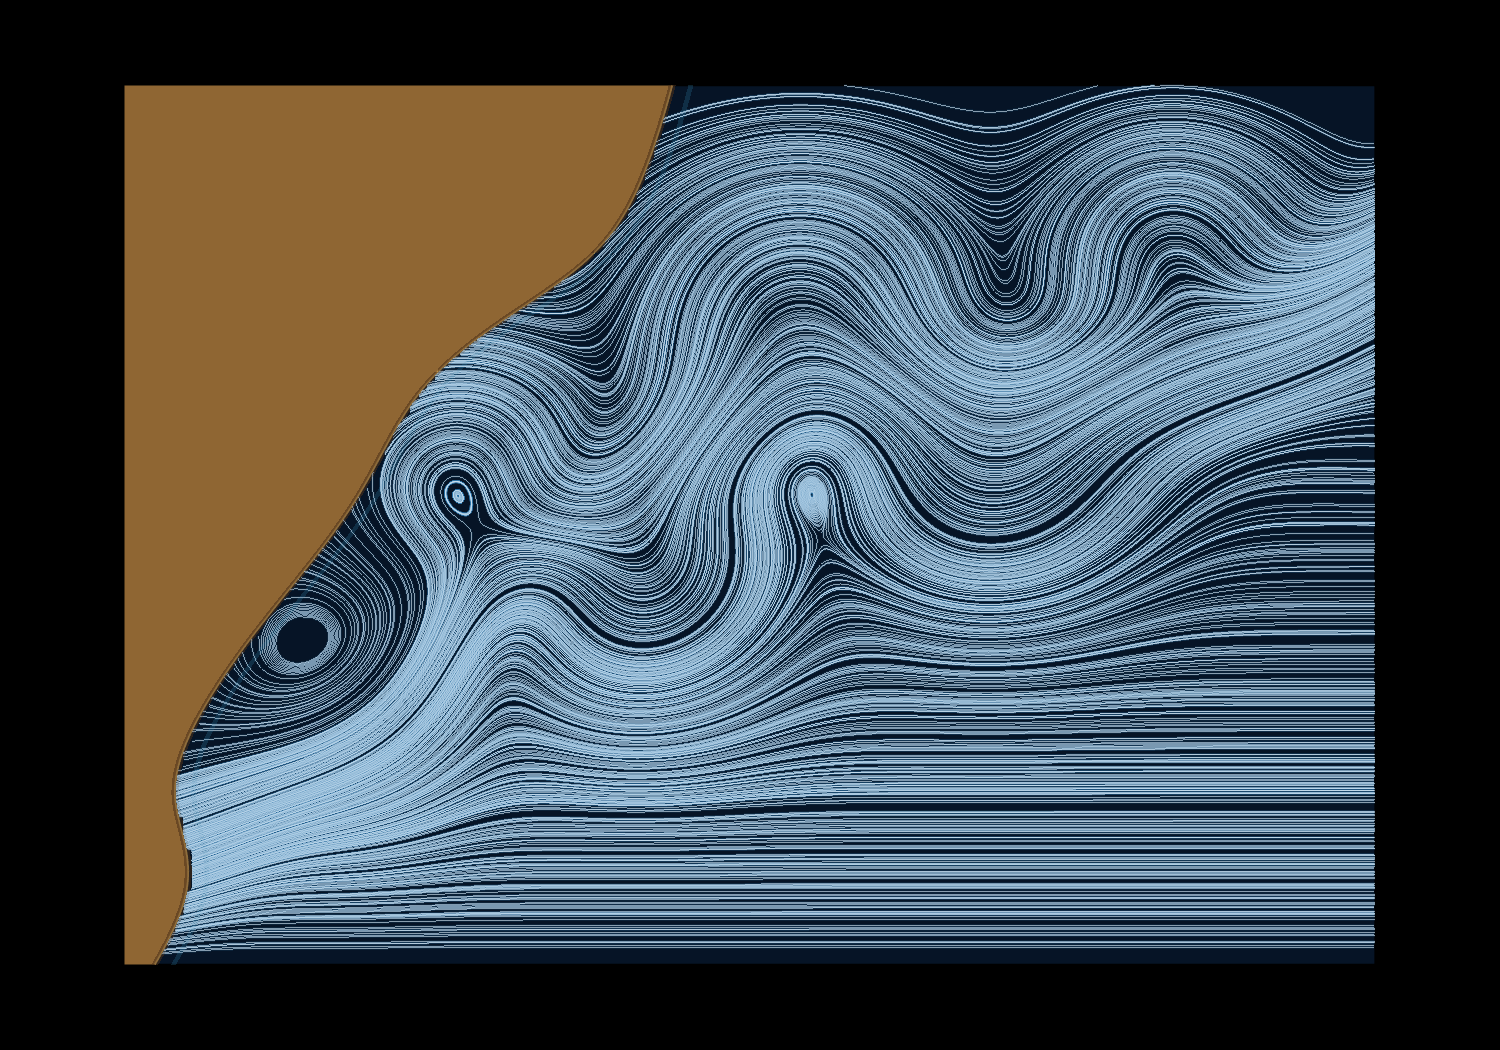
Sparse
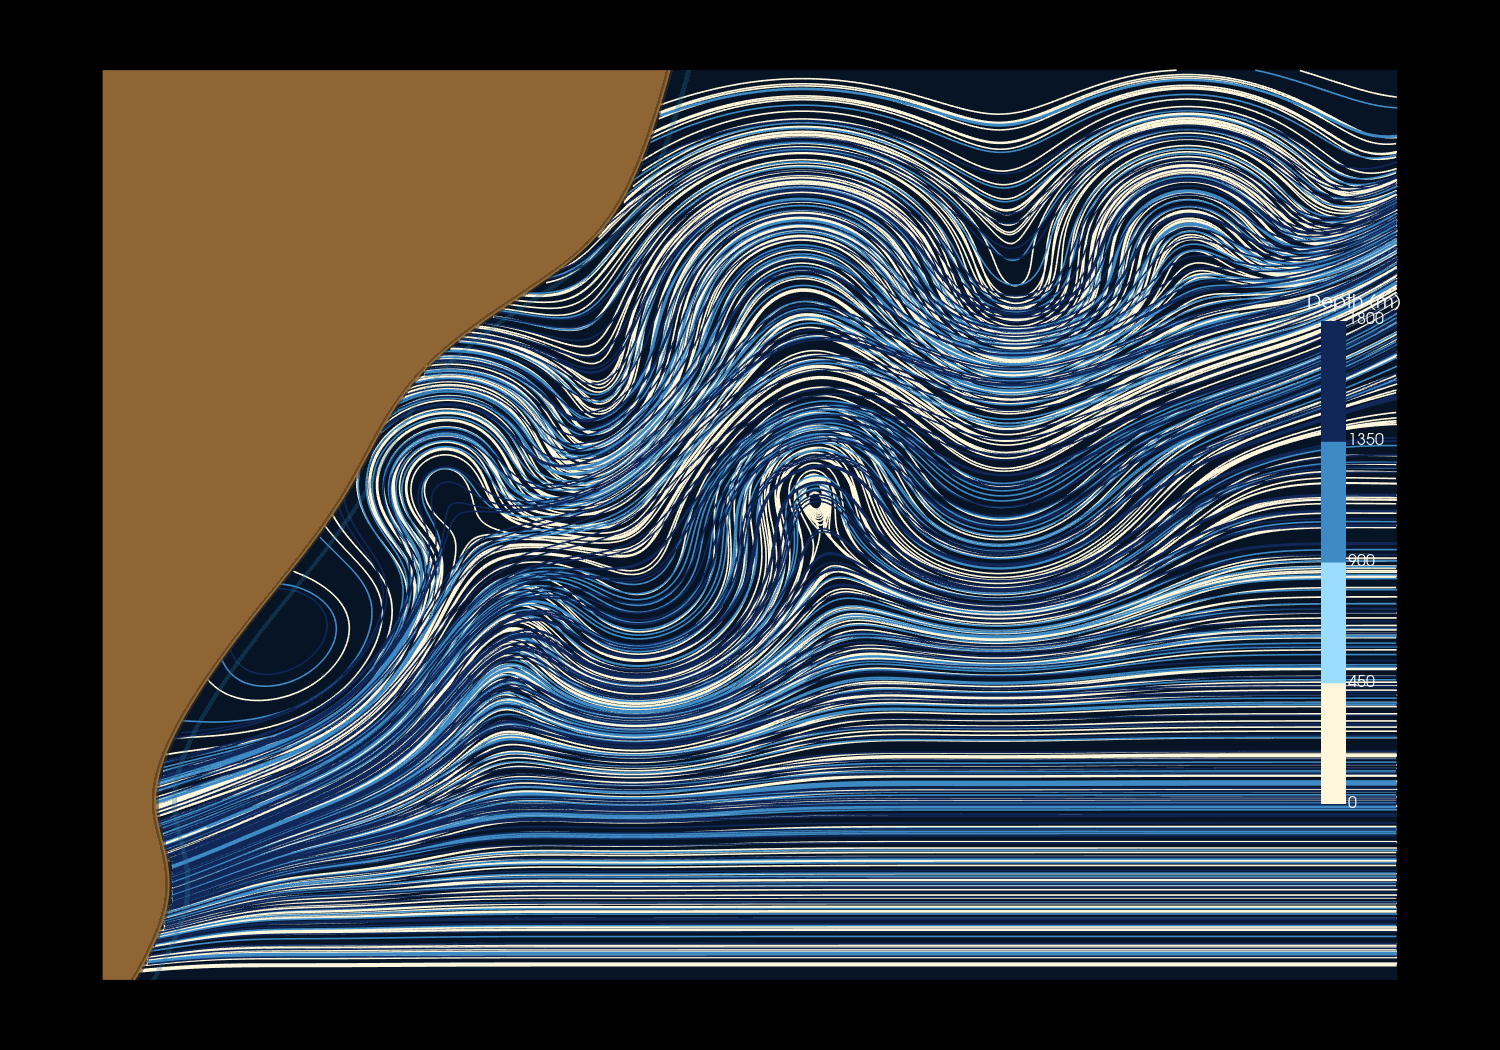
Depth - four layers, darker blue is deeper
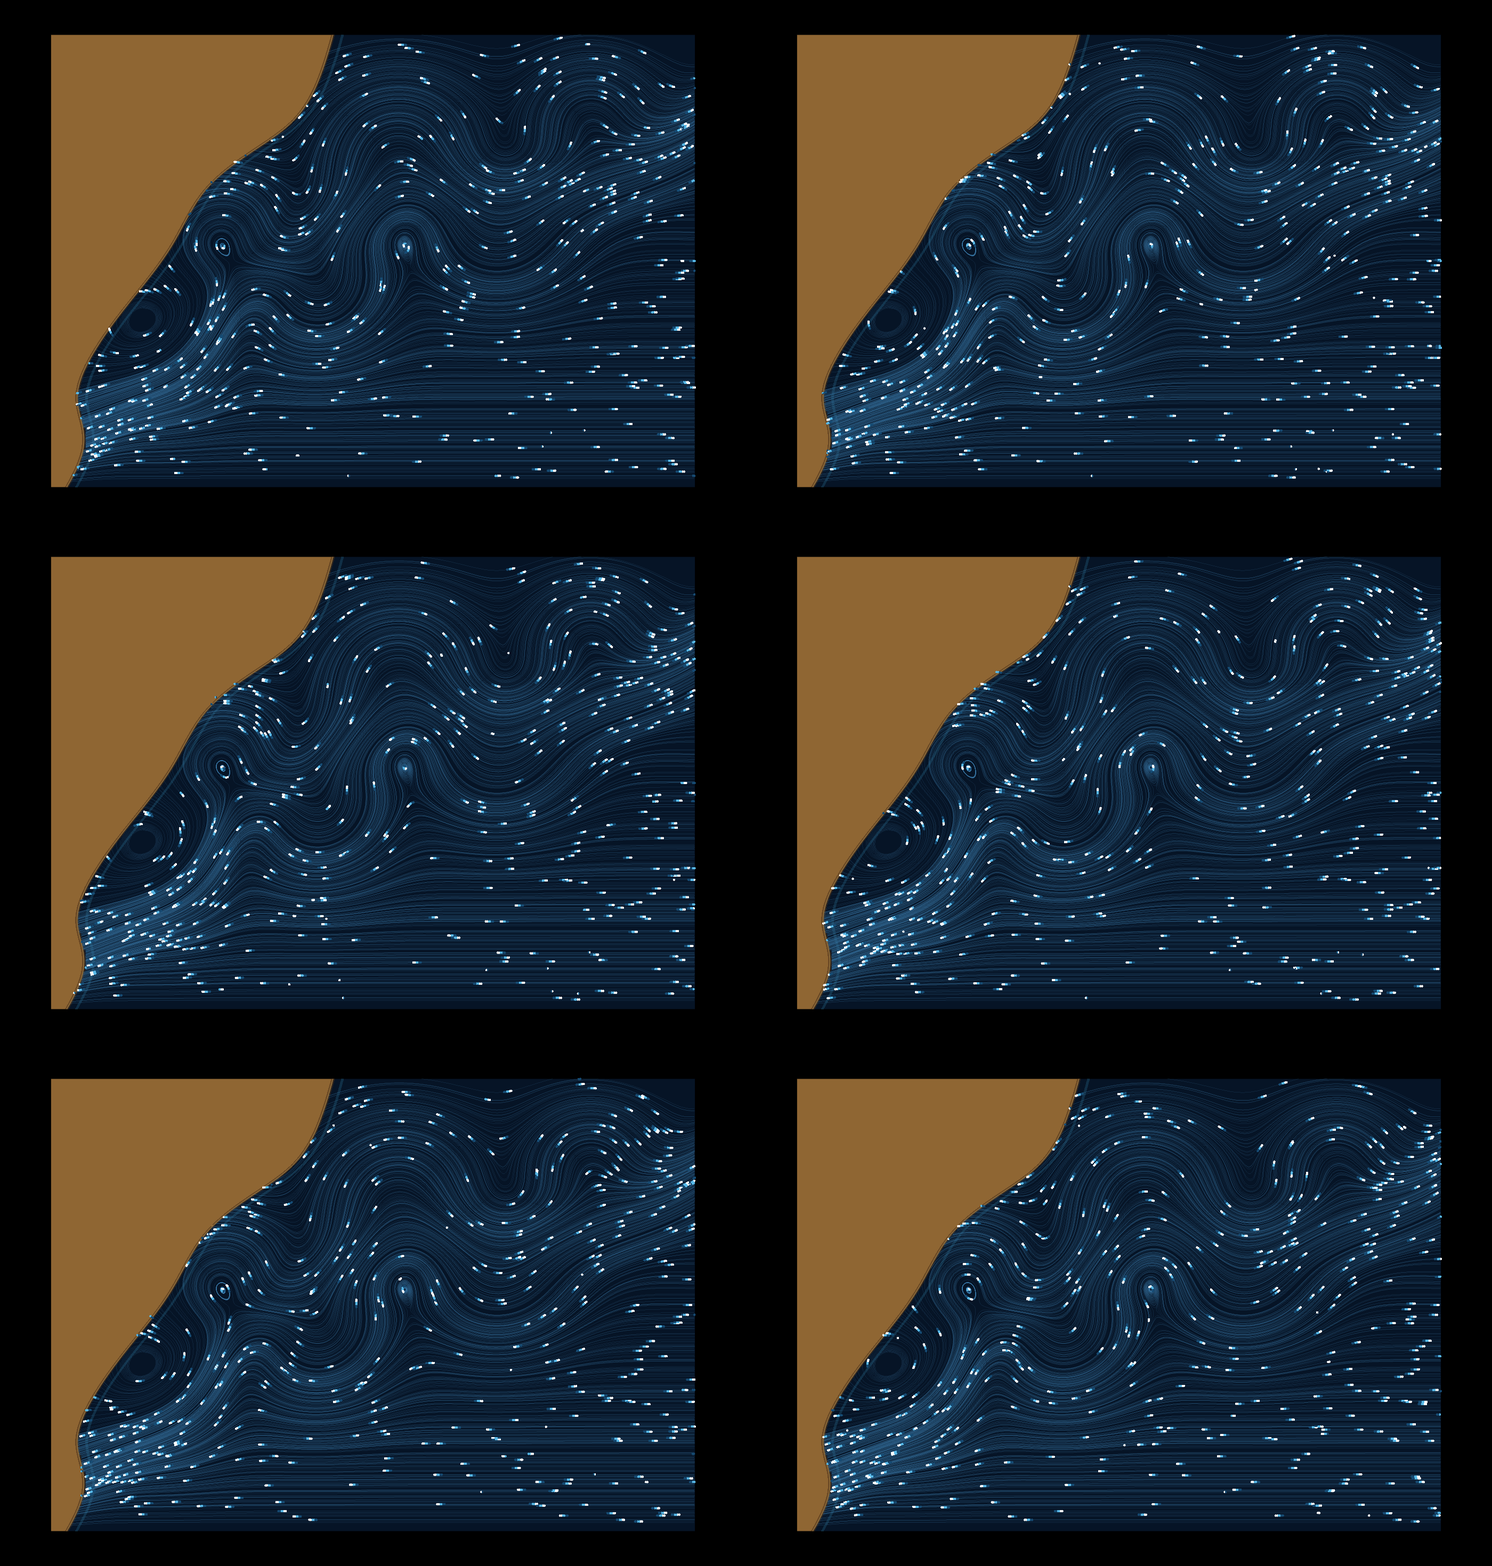
Time - tracer particles moving along the network
- Illustrative Gulf-Stream-style model inspired by NASA’s Perpetual Ocean; not scientific ocean-model output
Streamlines, and More
Stationary vs. Over Time
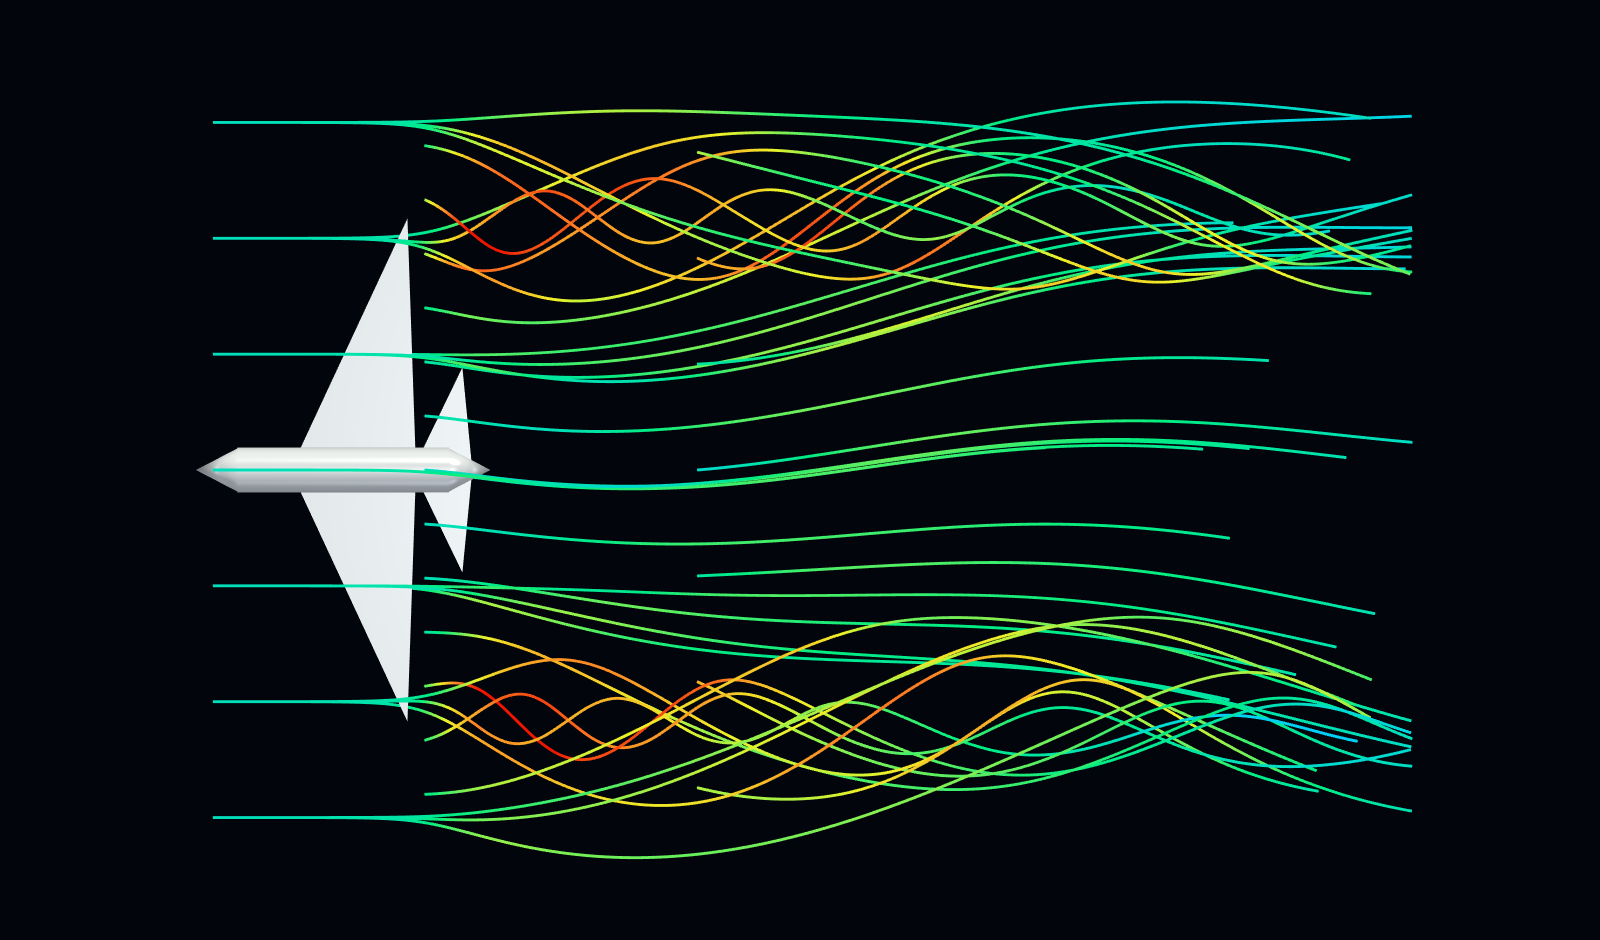
Streamlines - snapshot of flow direction
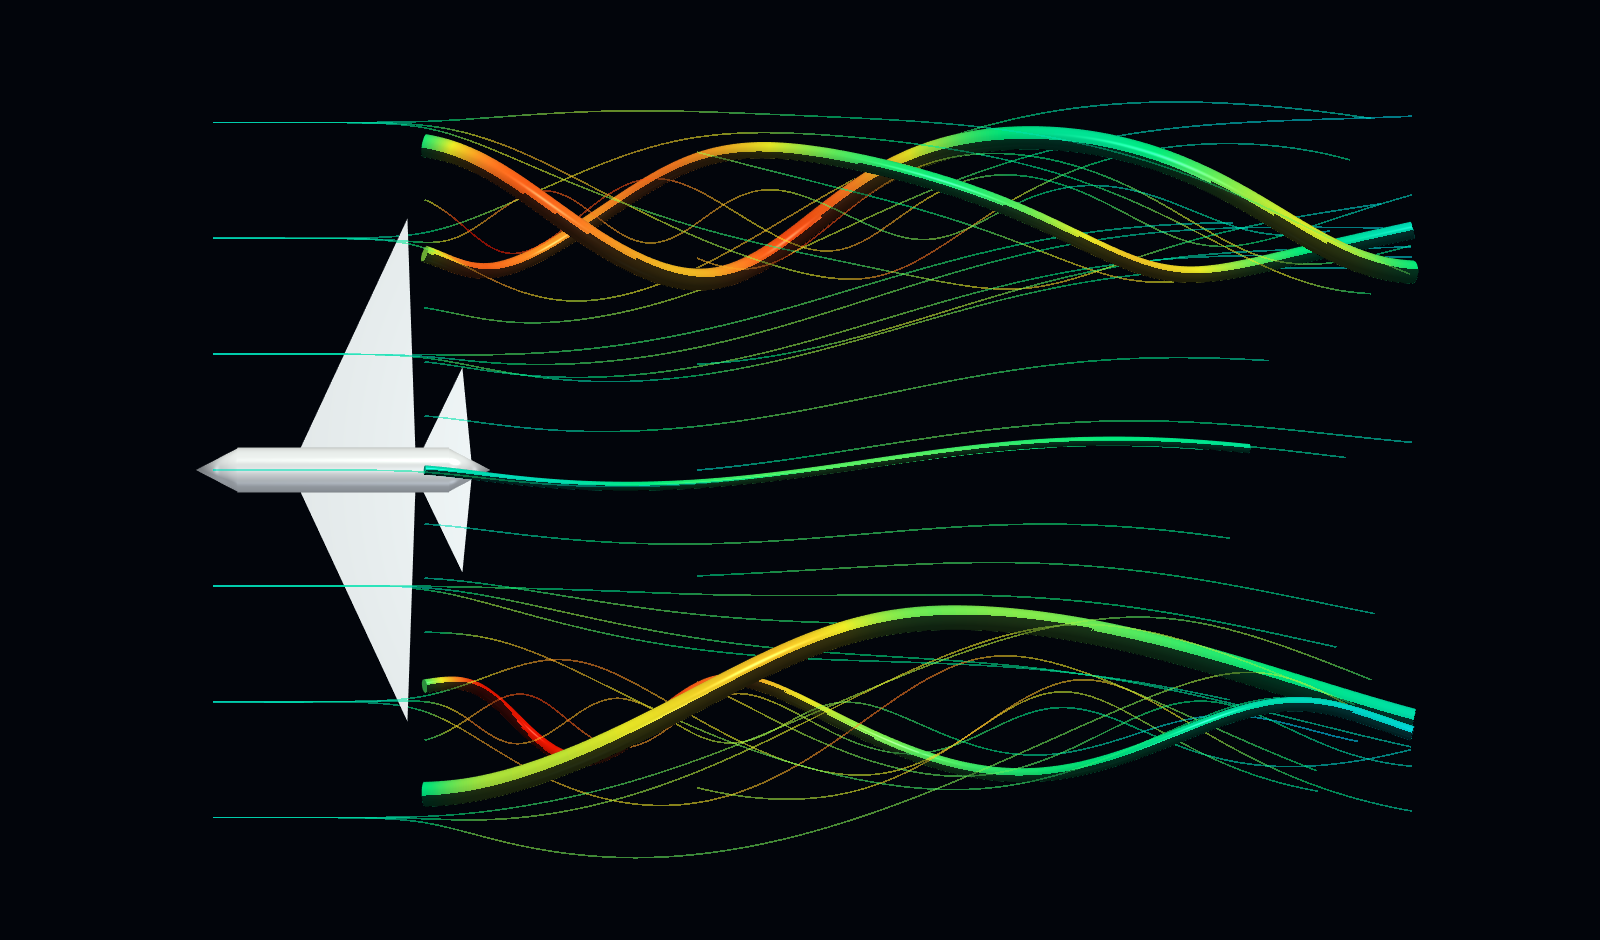
Streamtubes - bundles of streamlines
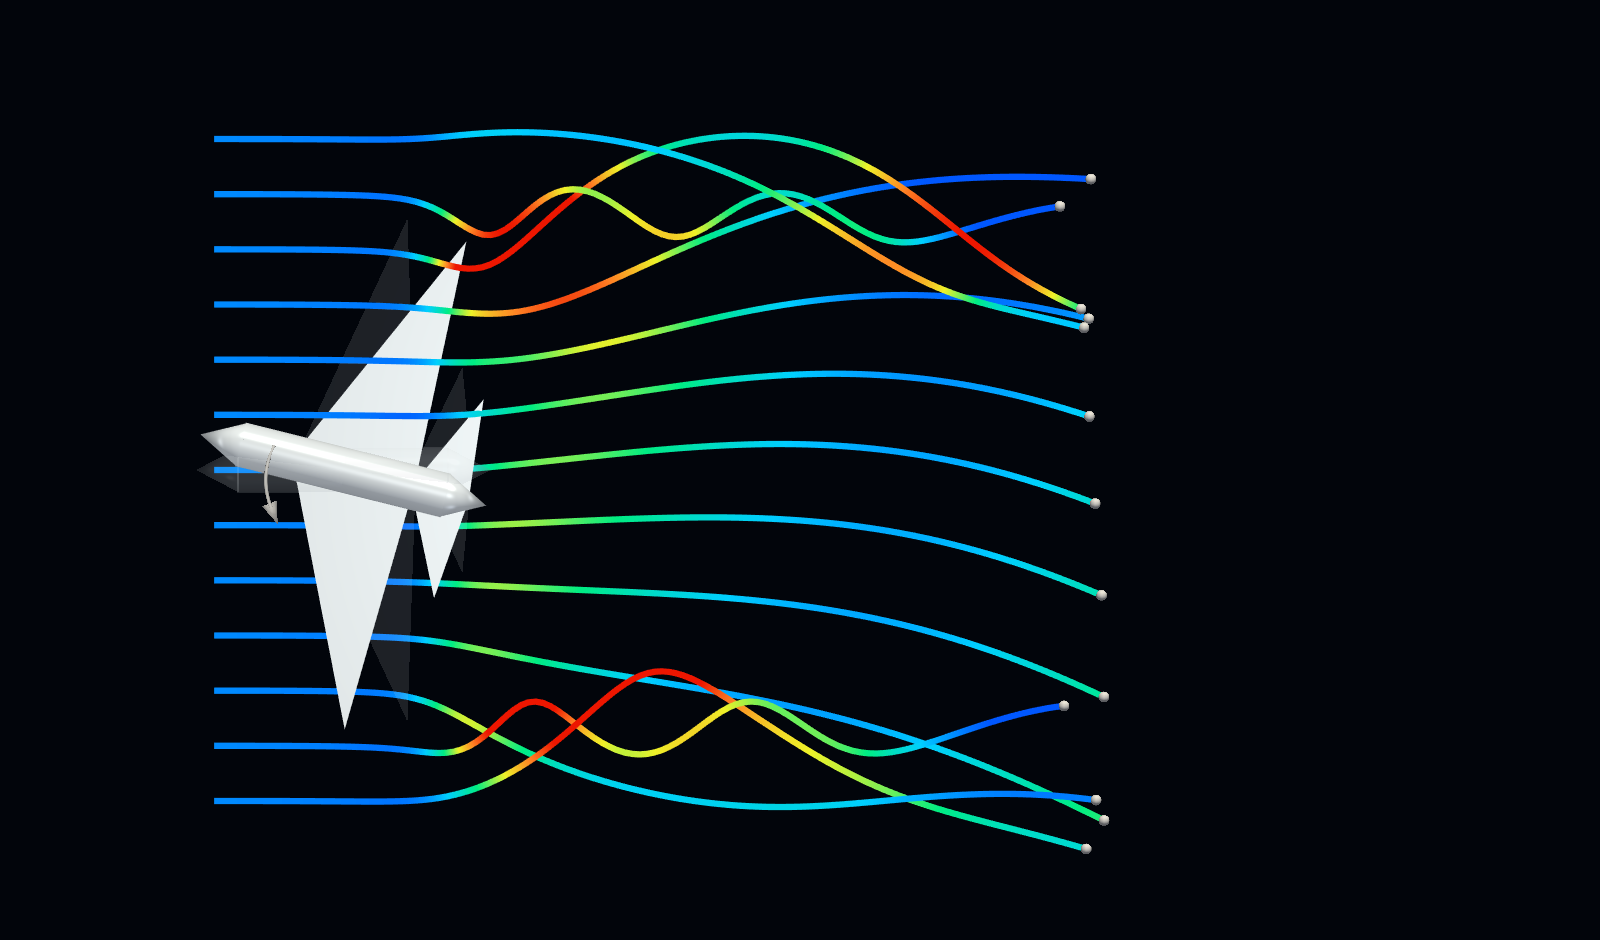
Pathlines - particle trajectory over time
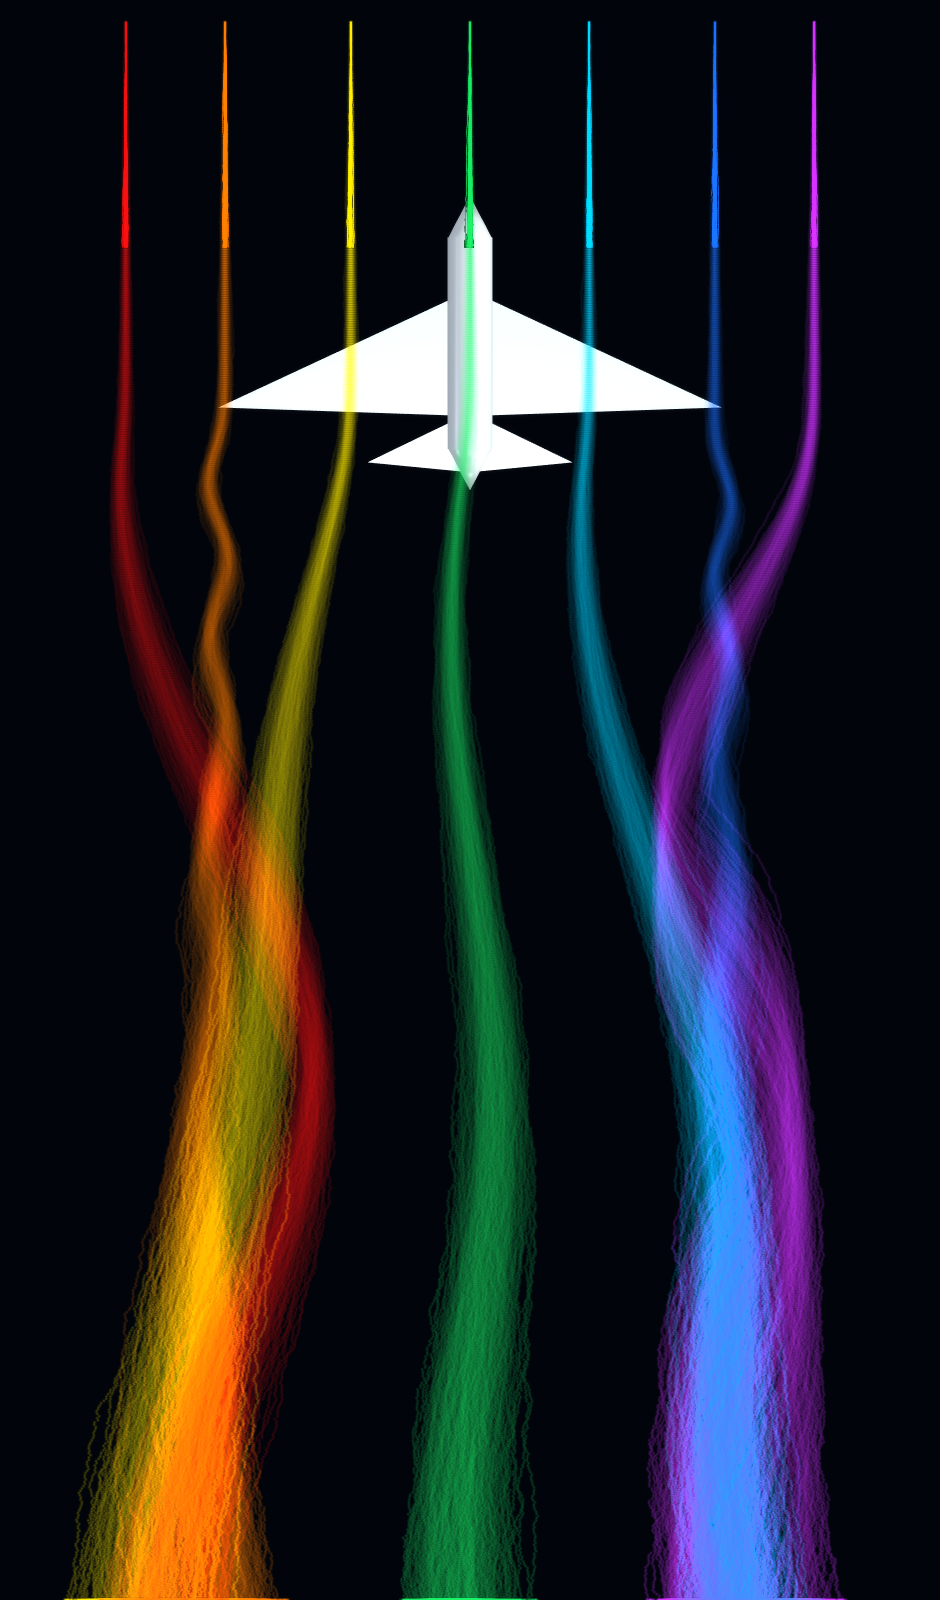
Streaklines - dye injection trail over time
- Stationary: streamlines, streamtubes · Over time: pathlines, streaklines
- Synthetic aircraft-wake model: forward flow, counter-rotating wingtip vortices, a time-varying gust
Vector Field as LIC
Line Integral Convolution
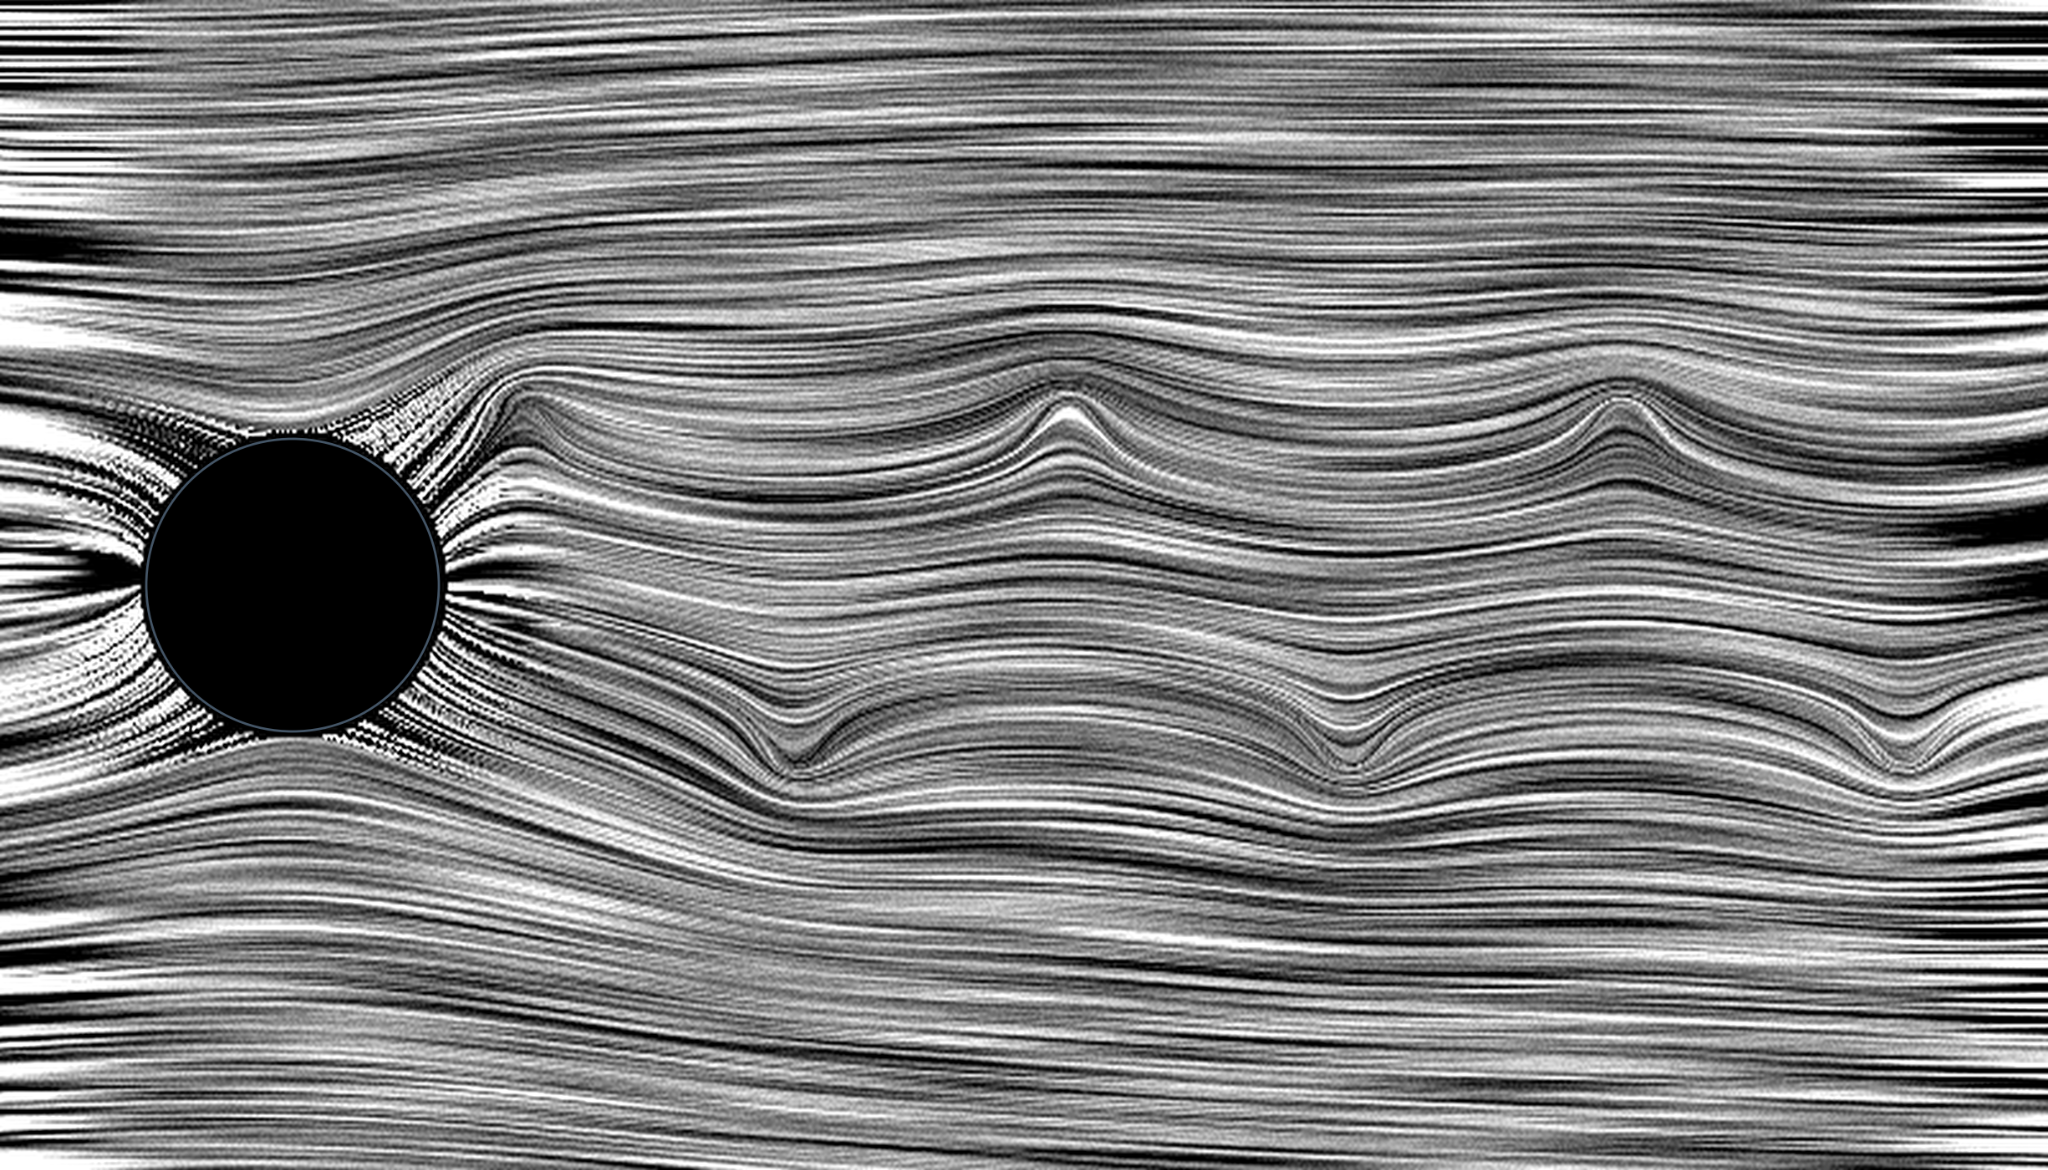
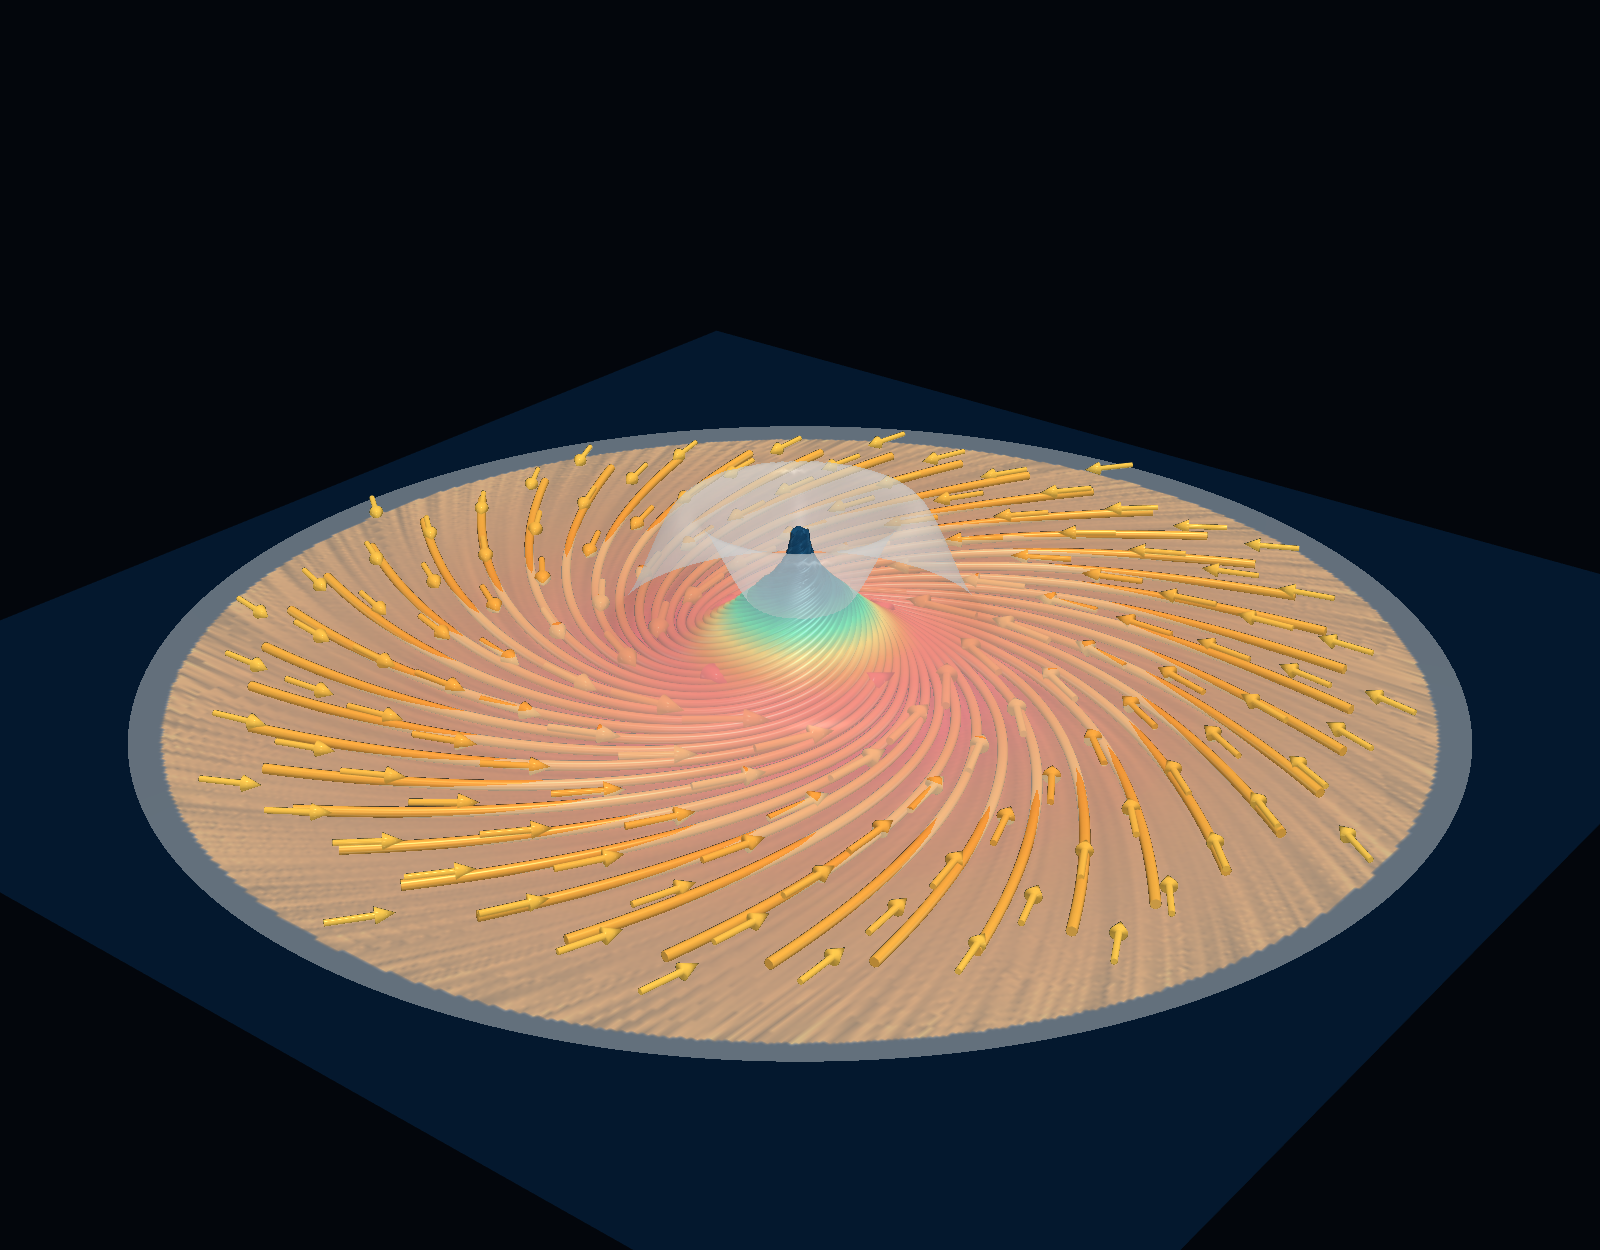
Flow past a cylinder
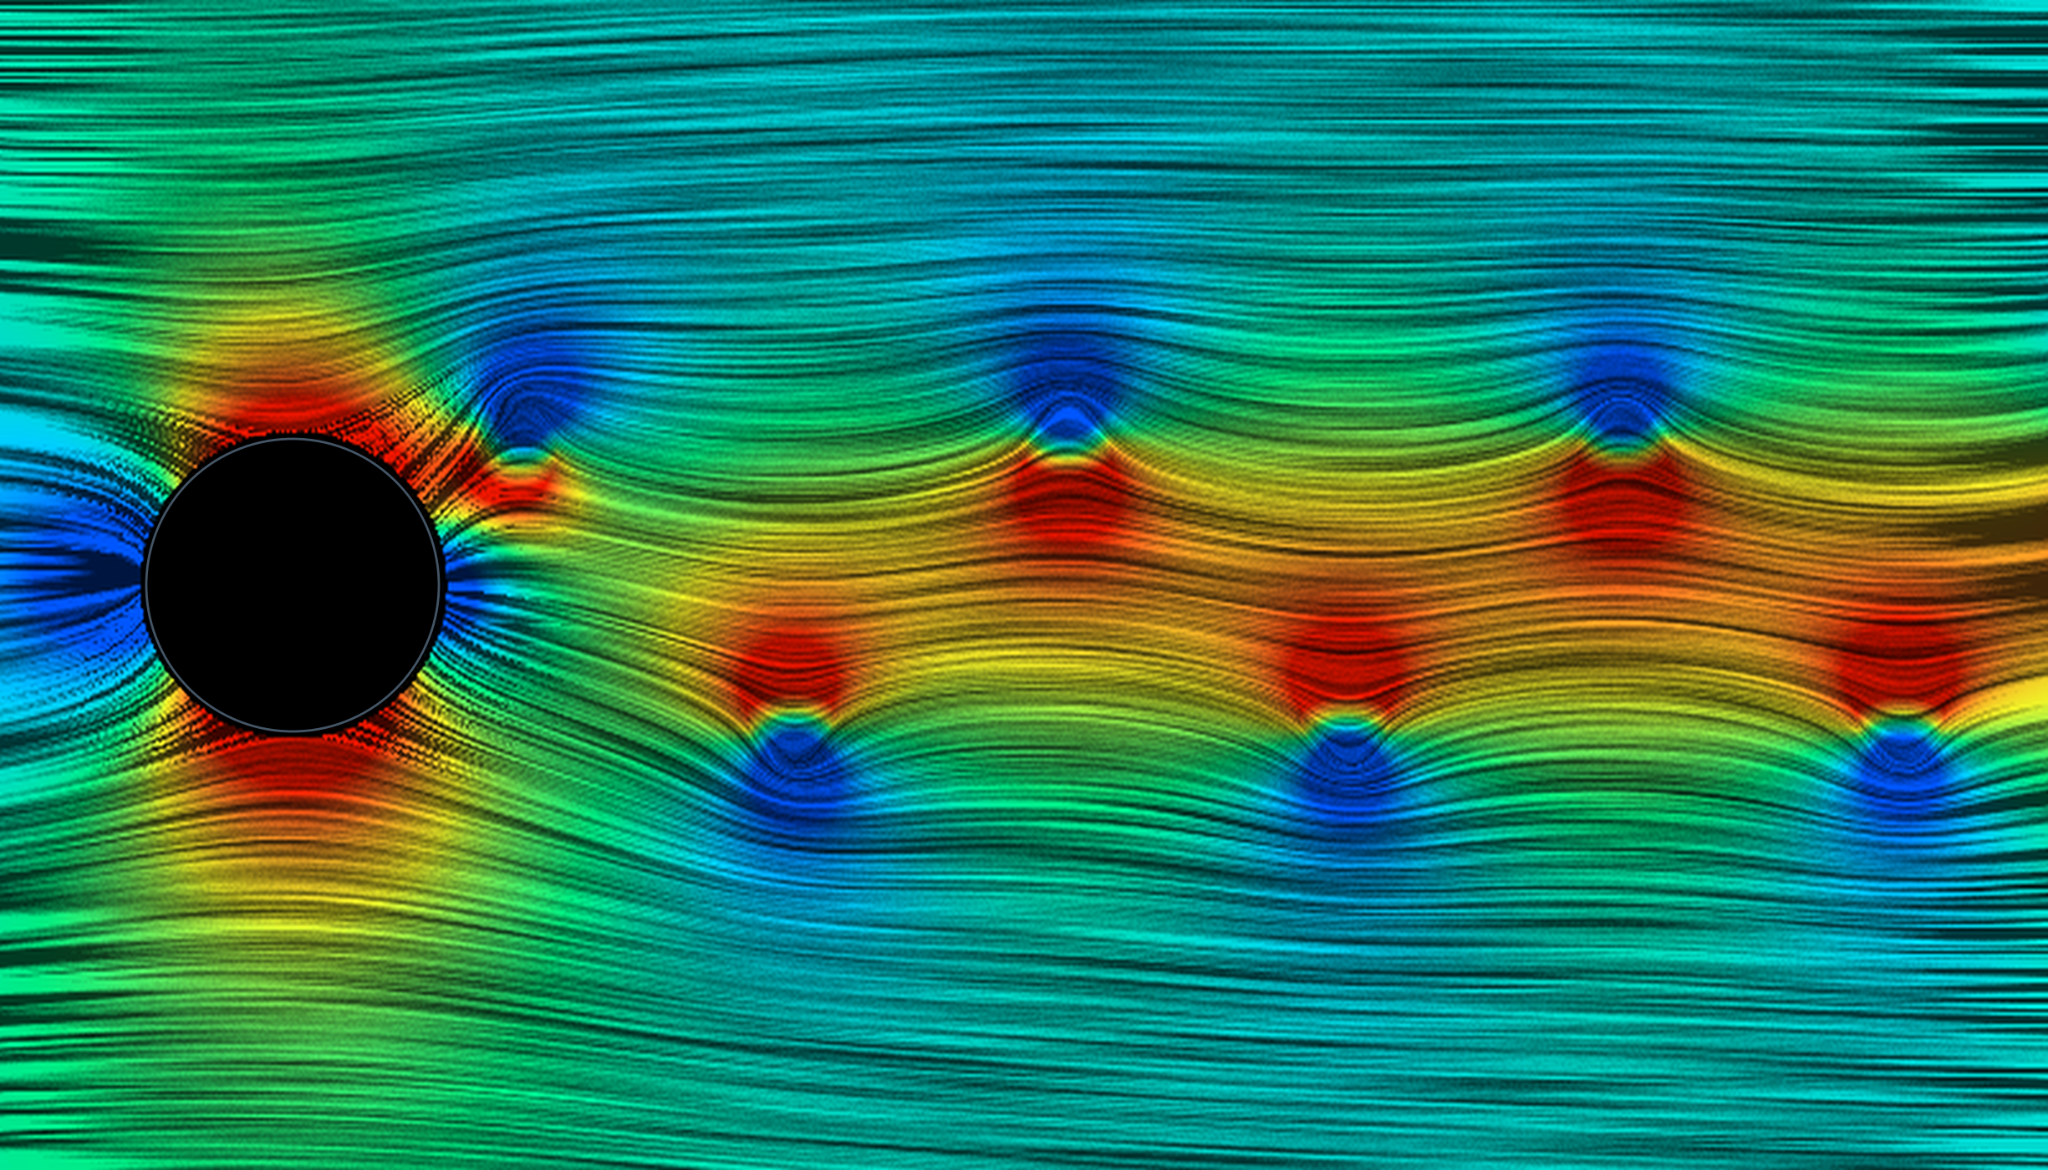
Color e.g. magnitude
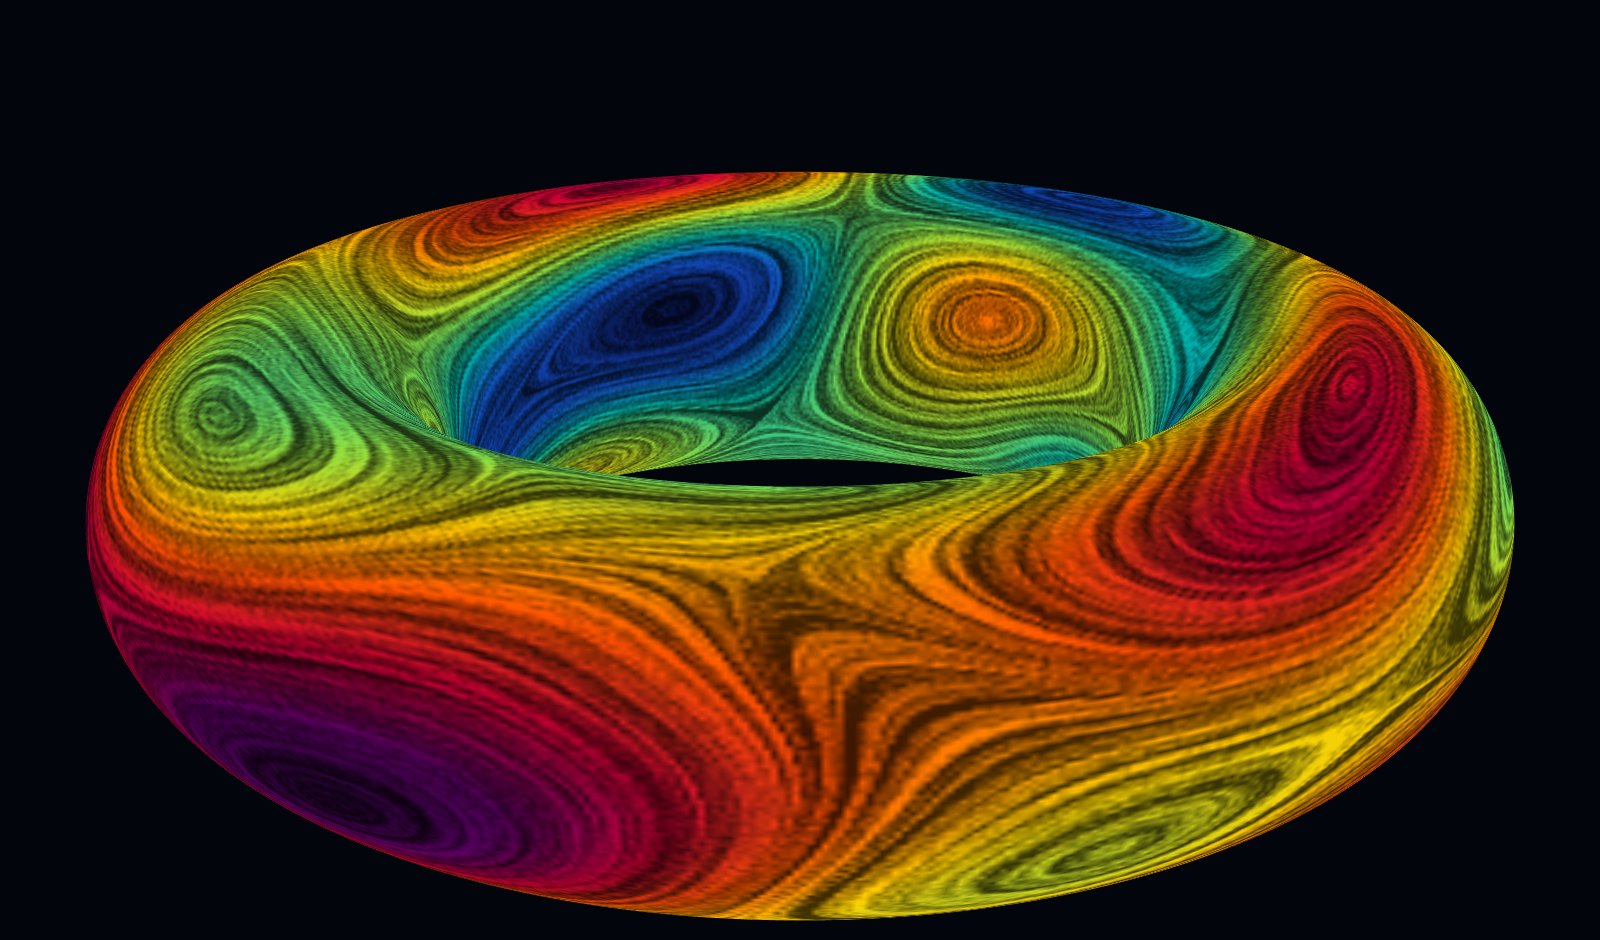
Surface overlay
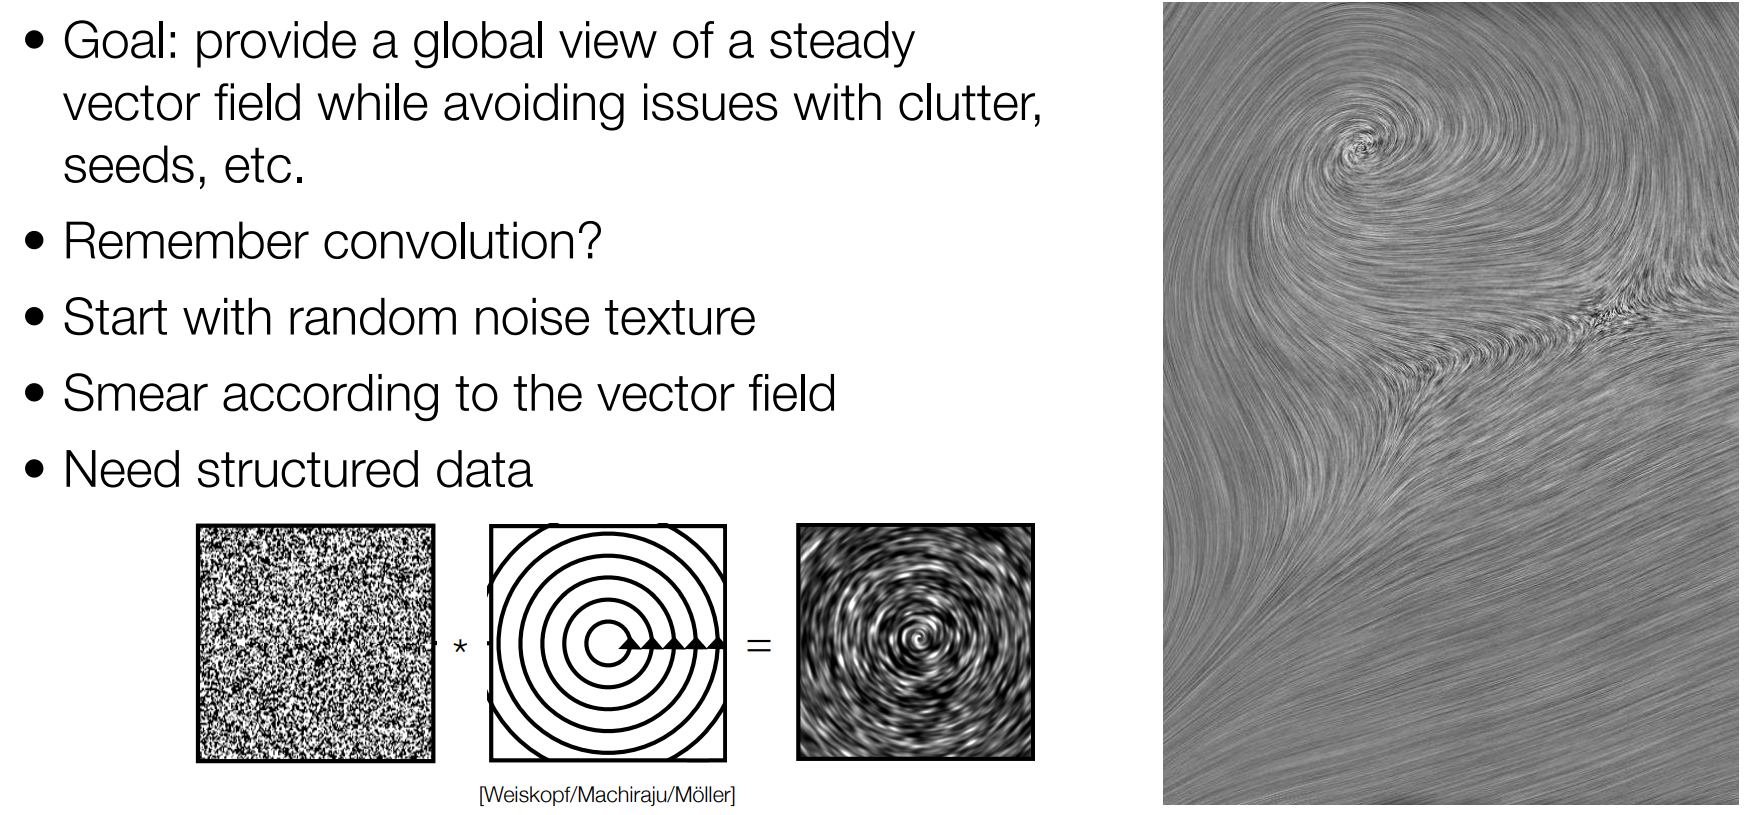
Noise, smeared along the field, is the whole method
- LIC schematic: Weiskopf / Machiraju / Möller
Usually You Want a Combo
There Are So Many Ways of Representing the Same Data
Glyphs + volume, tornado
Streamlines + LIC + volume, tropical cyclone
Before You Visualize: Ask Yourself
What Shape Is Your Data?
- List what needs to be visualized, and think of the best combo of visualizations
- Will it look best as 2D, 3D, or 4D?
- e.g. show time as animation or a time slider (or e.g. stream paths)
- Will it look best as 2D, 3D, or 4D?
How to Deal With Clutter and Occlusion?
- Color - e.g. separate depth by hue, not position
- Sparsity - fewer, well-chosen samples
- Clipping - cut the mesh open
- Opacity - make the obstruction see-through
Tool Comparison
| Tool | Interactive Visualization? | Scriptable / Reproducible | Rendering Quality | Learning Curve |
|---|---|---|---|---|
| PyVista / VTK | Yes | Yes (Python) | Good | Medium |
| ParaView | Yes | Yes (Python) | Good | Medium-High |
| MATLAB | Limited | Yes | Basic-decent | Low-Medium |
| Blender | Yes | Yes (Python) | Excellent | High |
Try It Out
Jupyter Notebook
uv venv .venv_vector_field --python 3.12 --seed
uv pip install --python .venv_vector_field -r visualization_software/requirements_vector_field.txt
uv run --python .venv_vector_field jupyter lab
- vector_field_visualization.ipynb - every figure in this deck, live and interactive